


An Update To The NFL Draft Similarity Model
The calm before the big game storm.

Hey everyone! I wanted to start with another thanks to my new subscribers from my NFC Championship preview write-up. The week before that, I wrote that I hit my record for most views on a post, and then you guys helped me double that record last week! I am so grateful for all of your support, your posting, and your sharing. I will be back with a Super Bowl preview next Thursday or Friday, but in the meantime I wanted to preview some of the NFL Draft related things I’ve been working on.
That’s right, the NFL analysis doesn’t stop at The Spade when the season stops. We continue rolling right into late April when the draft occurs. Last year I created a cosine similarity ML model to compare player stats and player draft combine stats simultaneously to try and create a full-scale player comparison I haven’t really seen online yet. Cosine similarity is about as basic of an ML model I could use (ex: 1 and 2 are closer to each other than 1 and 10, so 1 and 2 would be the output of the cosine similarity model) for this study, but I think it yielded some really interesting results in 2024 and hopefully will bring better insights into the 2025 draft. I had a really fun time analyzing the outputs and seeing just how similar some player production and combine stats could be to each other, and how many comparisons were drawn that I hadn’t seen before. Usually, the comparisons seen online are from a film watching perspective, or a combine stats perspective. For better or worse, combining player production and combine stats creates an entirely new perspective that I believe others will find interesting.
Enough rambling, here’s what I got for you today.
Where We Left Off in 2024
Last year, I downloaded some NFL combine and pro day aggregated data from NFLCombineResults.com dating back to 2010. This data shows each draft prospect’s combine numbers and replaces them with available pro day data if it differs. For example, if a draft prospect didn’t run the 40 yard dash at the combine but did on his pro day, the data would display the pro day dash time instead of an empty value.
I combined this data with data I manually inserted into Google Sheets from College-Football-Reference.com (yes, it took forever) that summed up each players total stats from college, including how many games and years they played. Both the combine data and the player stats dated back to 2010, and I uploaded them as csv files in my repo. Once they were in the repo, I would generate images using matplotlib that displayed radar charts of each player’s positional percentile for their available data points and export that as an image. Here are some of the results from last draft:


I really like how the visualizations turned out, but of course encountered some problems along the way:
Halfway through generating the radars, I realized I didn’t account for the measures where having a smaller number was indeed better (ex: a 4.2 40 yard dash is better than a 5.2 40 yard dash, so the 4.2 runner should be in the 99th percentile instead of the 1st percentile).
The radars just look clunky to me, we have some percentile labels overlapping with the measure names.
I only had total college career stats so I had to make these weird average measures, like completions per game and rushing attempts per game.
Most of these issues appeared because I was flying by the seat of my pants and I decided to begin this project around March (6 weeks before the draft). And I spent way too much time copying and pasting data. This time around though, I decided to actually use some of my data engineering skills on these datasets to create a better comparison.
I was happy I had results to display, but wasn’t exactly satisfied with the outcomes.
So What’s New For 2025?
For the 2025 NFL Draft I am giving myself more time to work on the project, I started revisiting it last week instead of two months from now. I also already have all the data and collected more of it. This time I used the CFBFastR API to grab season-by-season stats for every single college football player since 2008, since I now know how to code in R. I also expanded the combine/pro day data to go back to 2008 instead of 2010.
Make no mistake there’s still more work to be done. For my data engineering colleagues, I’m following an ELT process instead of ETL for this one. I’ve extracted the data from the API and combine website and loaded it into my repo in the form of csvs, except now I have to transform the data to make it glue together well. I also want to improve on the visualizations I made last year, creating a more legible player comparison card that just straight up looks better.
I very much consider all this to still be in beta, especially since the 2025 prospects haven’t even participated in the combine or their pro days yet. We’re only on Day 2 of the Senior Bowl right now! But with this early start I’m excited to bring a much better product to my readers this time around.
As of January 30, 2025: Here’s my to-do list:
Complete the data cleaning process. I had to join the combine data and player stat data in based on player name, so there’s some discrepancies. For example, he appears as Mar’Keise Irving in the player stats dataset, but he’s Bucky Irving in the combine data. Or how there’s multiple players with the same name. There’s also of course some FCS players whose stats don’t appear in the CFBFastR dataset and players who did not participate in the combine. I can either spend my time creating a very long if-statement in Python or can manually change the data, haven’t decided yet.
Finalize a format for the comparisons. Should I establish percentiles per position or based on the entire dataset? Should I use cosine similarity on these percentile calculations or on the raw numbers? Should I put weights on different combine and stats measures to try and drum up more realistic comparisons?
Finalize the format of the matplotlib output.
Watch even more NFL Draft prospect film so I can give better insights to my readers. This isn’t on the development to-do list, but still needs to get done.
Luckily, CFBFastR establishes an athlete_id field that corresponds with the player’s ESPN.com id, allowing me to easily grab some headshots to help with the visualization.
Here’s the first edition of how these radar charts will look! I’ll be providing more updates as we get closer to pro days and the combine, but here’s a few visualization betas.
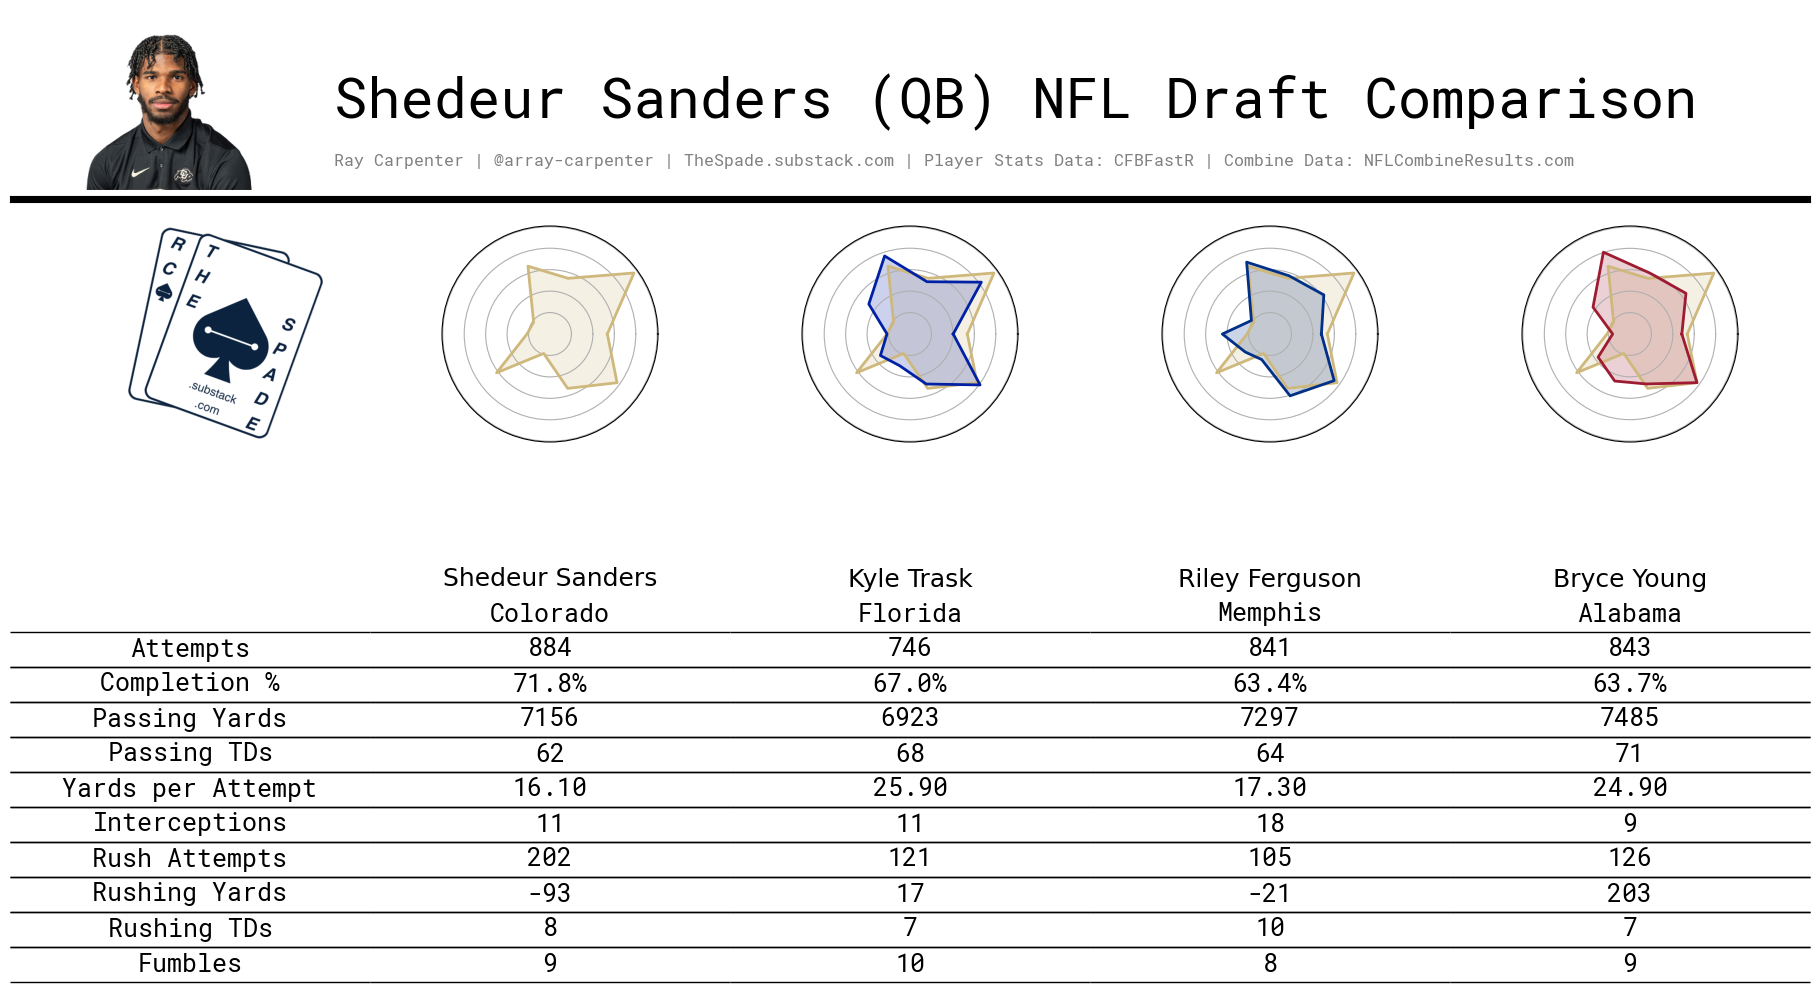
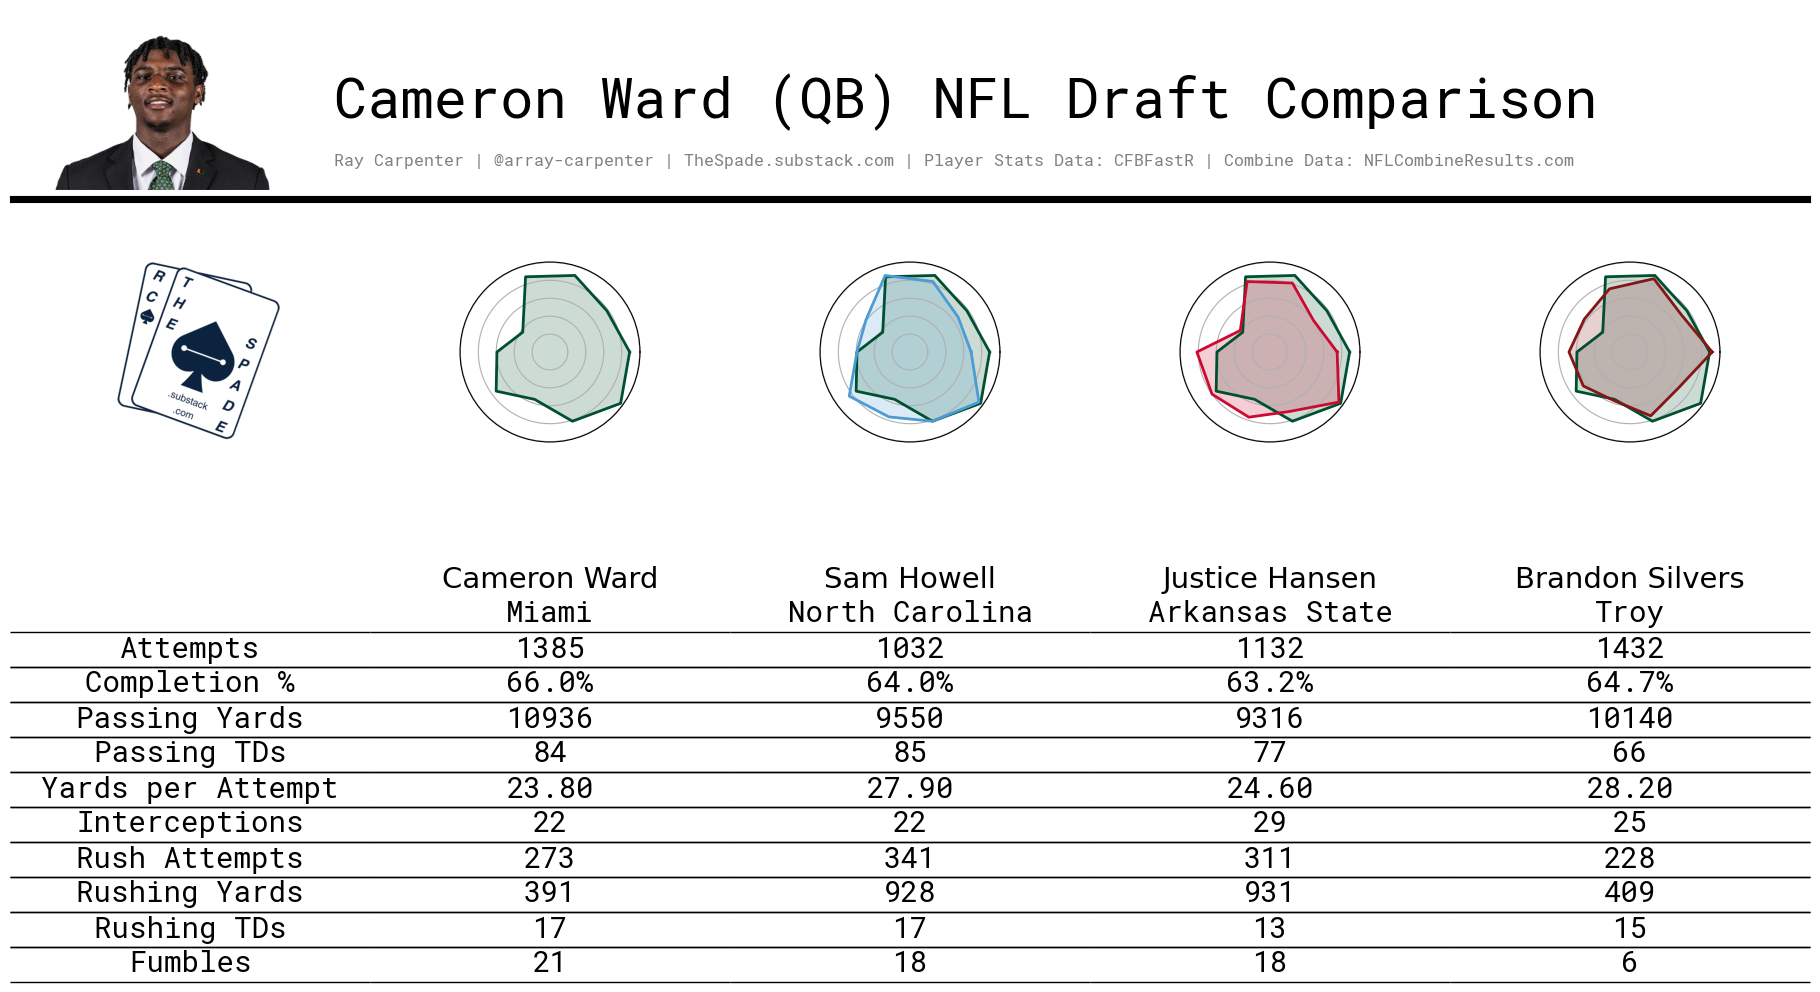
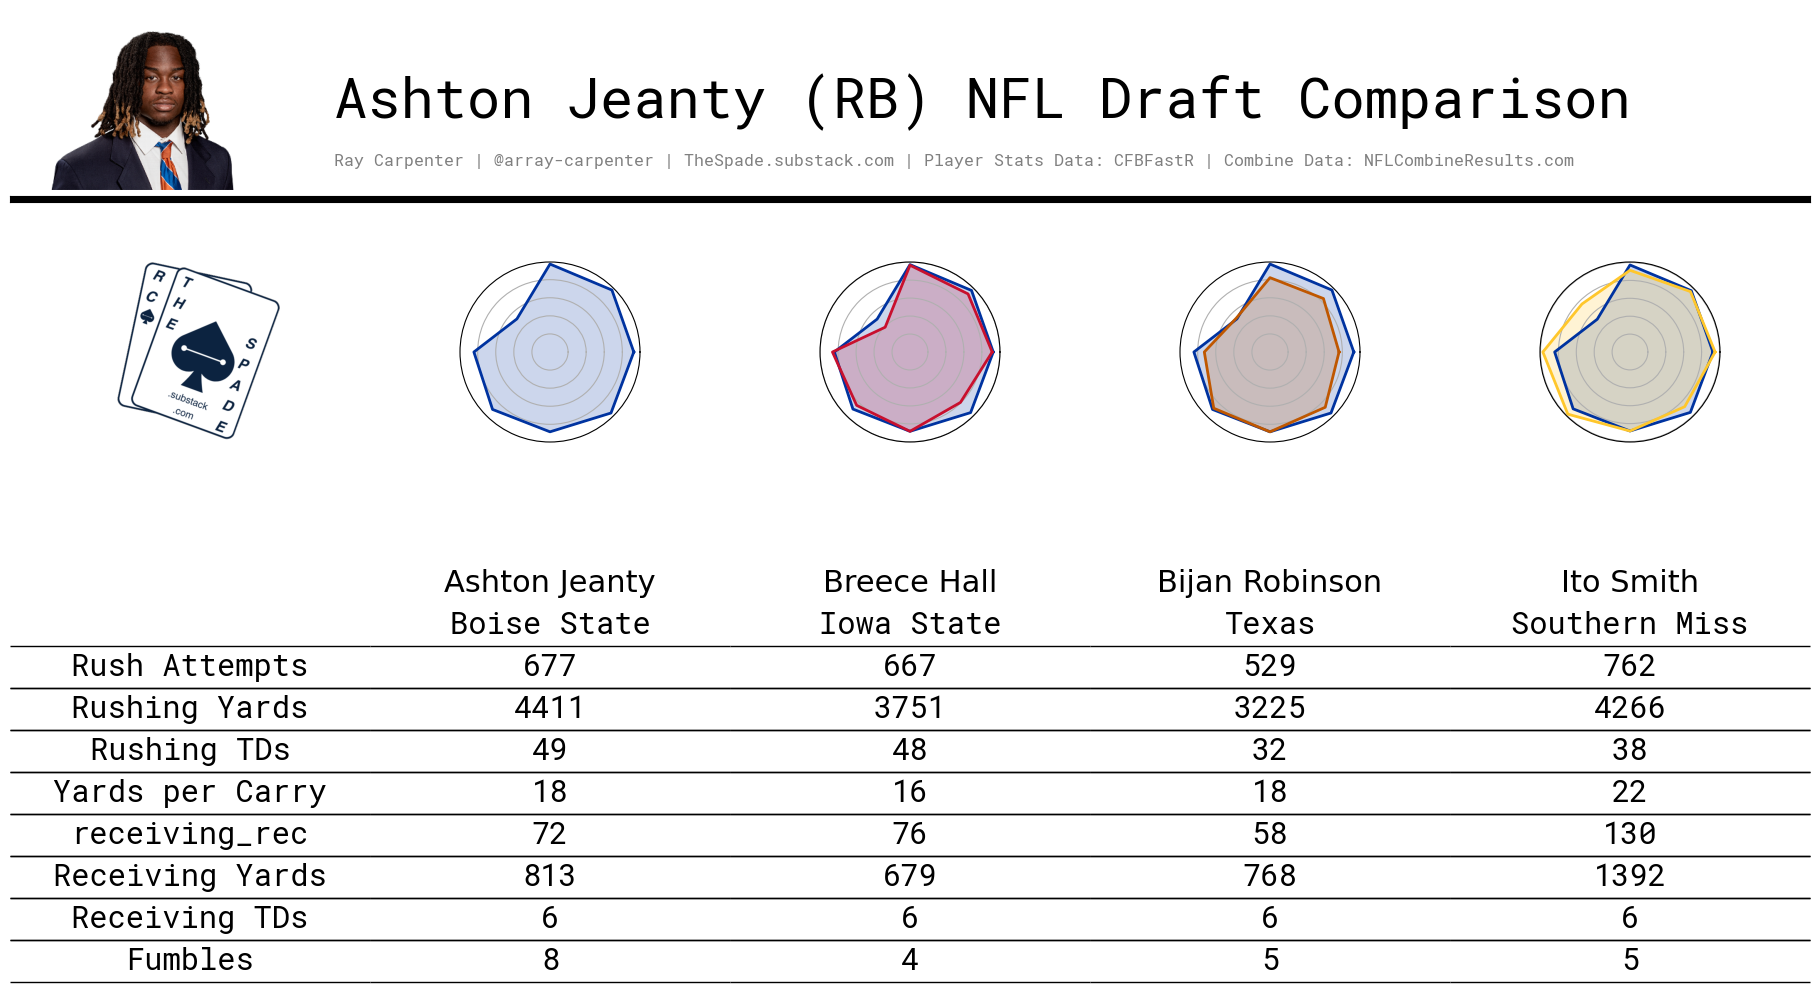
I think these look really good already, but there’s obviously some more tweaks I can make to the layouts. Let me know what you think and comment below who you think the Tennessee Titans will take with the first overall pick in the 2025 NFL Draft!