


My faithful subscribers,
A few weeks ago I published a tutorial and alluded to something that’s constantly on my mind - when to use specific tools for certain jobs. Those tools were the languages Python and R. I heard back from enough of you interested in the subject that I thought I should sit down and compile a list of when I use Python versus when I use R.
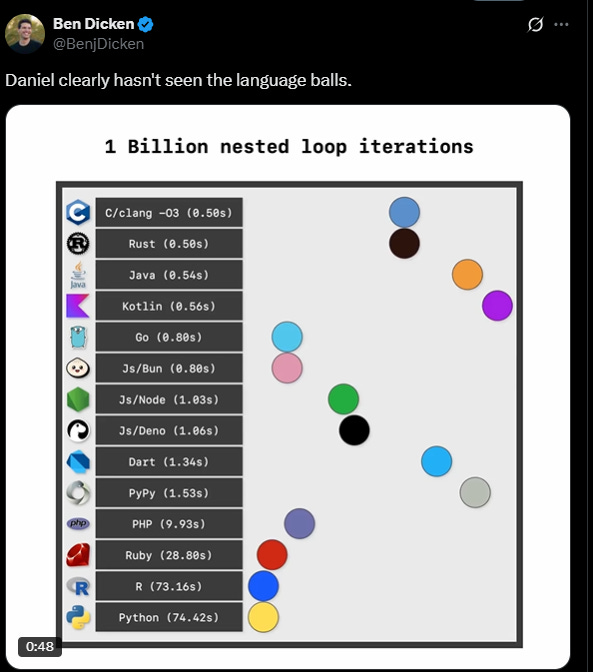
This nod to Python vs. R was brought on by a tweet I saw showing how long it takes to run 1 billion loops in some popular languages:
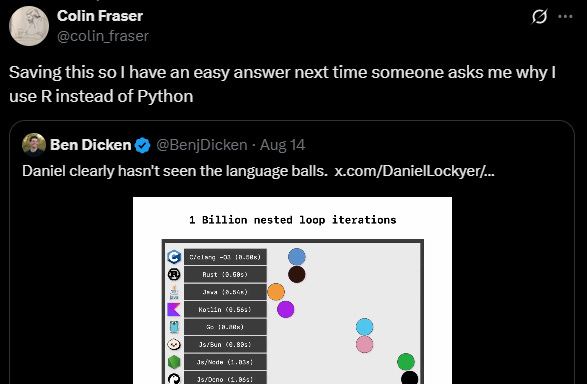
Which was then hilariously quoted by Colin Fraser:
As a data professional both of these languages are unavoidable, and to the untrained eye there might not be a lot of differences between the two. But from my perspective, here’s a quick list of when I use R and when I use Python when developing at work, creating new visualizations for The Spade, or any other coding endeavors I may embark on.
I hope you all enjoy it.
My Experience
My path to becoming a data engineer is a very long and winding story that I will save for another day, but I’ve been a data engineer since January 2021. I started as a DE at a mortgage company based in Philadelphia before moving to a fintech company based in New York where I’ve worked since August 2022.
What does a data engineer do exactly? Everyone likes to say it’s like being a plumber but for data. While that analogy works, I think it downplays how cool being a data engineer is. The plumbing aspect comes from creating pipelines for data to enter destinations, and the subsequent un-clogging of pipelines that is unavoidable afterwards. But I prefer the comparison of the data engineering field to being an archaeologist. In this analogy perhaps a museum curator (my boss) will send me to a dig site (the internet) to come back with a rare fossil (a dataset) so that it can be inspected (by a data analyst) and explained in further detail (by a data scientist), then presented in the museum (our business intelligence software) to paying customers (our stakeholders). I’m either completely on the nose or solely getting my comparisons to the archaeology field from Jurassic Park and Indiana Jones movies. Either way, I find what I do exciting.
Without giving too much detail, I field all sorts of requests at my job on a daily basis. Sometimes I’m asked to grab data that may or may not exist. And if it exists, it may or may not be accessible. And if it’s accessible the easy way or the hard way, it may or may not be in a workable format yet.
In the technical sense, this looks like a Python script hosted somewhere to extract data, another Python script to launder the data into a clean format for others to use, then loading it into a centralized location where my co-workers can easily access it. I go digging for the fossil, I find it, brush it a little bit, and hand it off to the museum.
There’s a lot of ambiguity in my job, which means that I am very cost-obsessed with everything I build. In the world of business technology, slower loading speeds equal more long-run business costs. So I’ve done a lot of research on Python and R in terms of how much memory a script of each will take up in the cloud, and how long similar scripts will take to run.
Enough about me though. Let’s jump into why you’re all here. We’re comparing Python to R in almost every way, right here and right now.
If you want to get started quickly…use R
Hitting the ground running with R is as simple as downloading R to your computer, and downloading your integrated development environment (IDE) of choice. I use Visual Studio Code as my IDE but I have also had positive experiences using both Positron and plain old RStudio.
If you have an idea and you have the data already, then it’s much faster to use R to start your project than it is to use Python to start your project. It’s as simple as installing your packages once at the top of your script, then importing those libraries and chugging away at your idea.
Also, the Comprehensive R Archive Network (CRAN) is an organization focused entirely on R’s specific use cases for data. Python suffers from its generalization in this category. CRAN has some amazing documentation that can help anyone who’s never developed before turn their idea into a graph with R.
If you need a more custom solution…use Python
On the flipside, Python is the more useful language when creating a bigger solution that will need more complex logic injected into it later. For example, if you don’t have your data yet and your data quantities may change week over week, Python is more suited for your project.
Keep reading with a 7-day free trial
Subscribe to The Spade to keep reading this post and get 7 days of free access to the full post archives.