
TransferPortl: Predicting College Football Transfers
A new website for you to see beyond transfer routes

Good afternoon everyone,
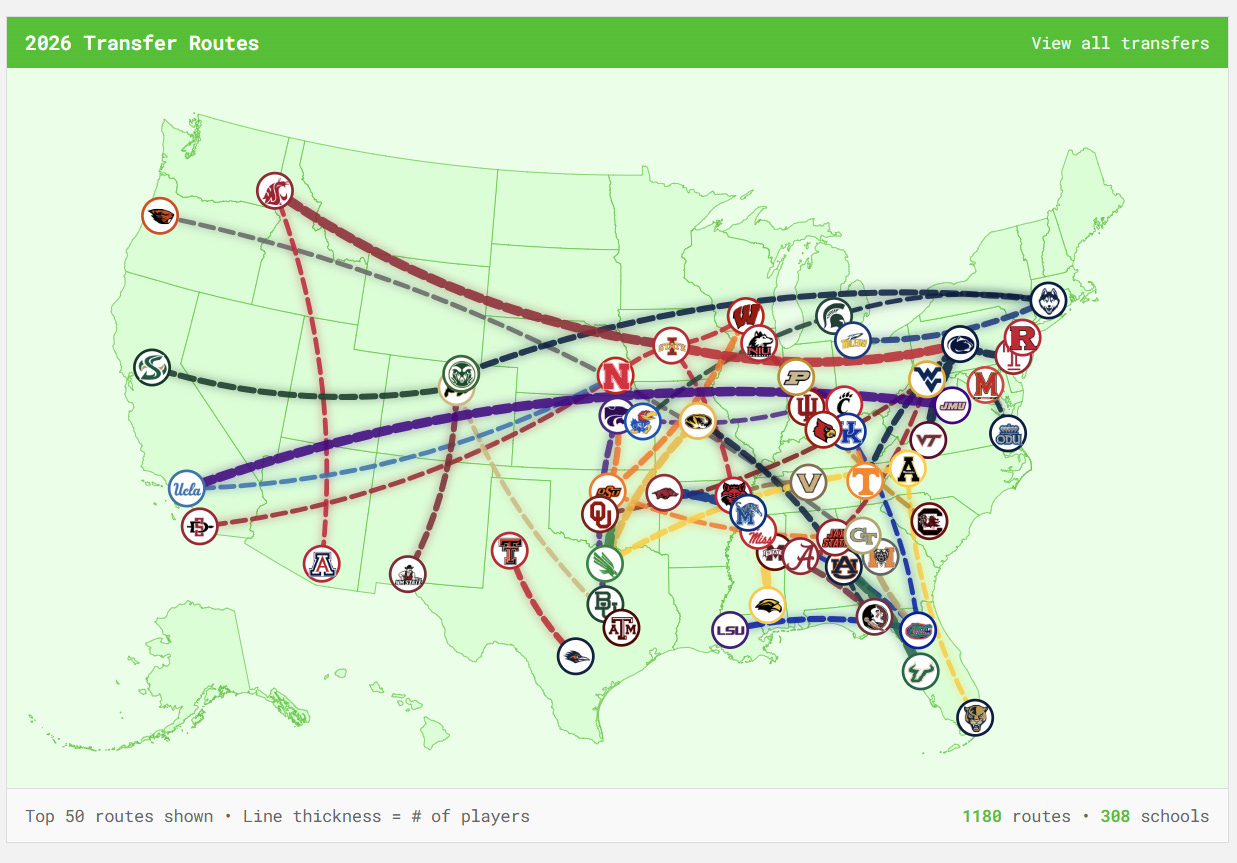
Last week I created a Shiny app that showed transfer portal routes for all players in this 2026 transfer window. I’ve been enjoying seeing the app auto-update every day and have the map become fuller with new routes.
But as soon as I shipped this, I thought it would make a really good front page for a full-scale transfer portal website. So I decided to spend the rest of last week building TransferPortl.com. The goal of TransferPortl is to provide free college football data about transfers, potential transfers, or future transfers. If you’re a soccer fan, my choice of words may sound familiar. There are tons of amazing, free resources out there that track the global soccer transfer market, but I don’t see any out there yet for college football that I feel are quite up to snuff. So I attempted to build the site I wanted myself.
On TransferPortl, you’ll find:
The transfer routes map on the front page
Three numbers up top, all which take you to different tables of players
In Portal: The total number of college football players who entered the transfer portal in 2026
Available: The number of players who haven’t chosen their new school yet
Committed: The number of players who have chosen their new school
A latest transfers table showing the most recent players who made moves
Recent portal entries: The most recent uncommitted players who entered the portal
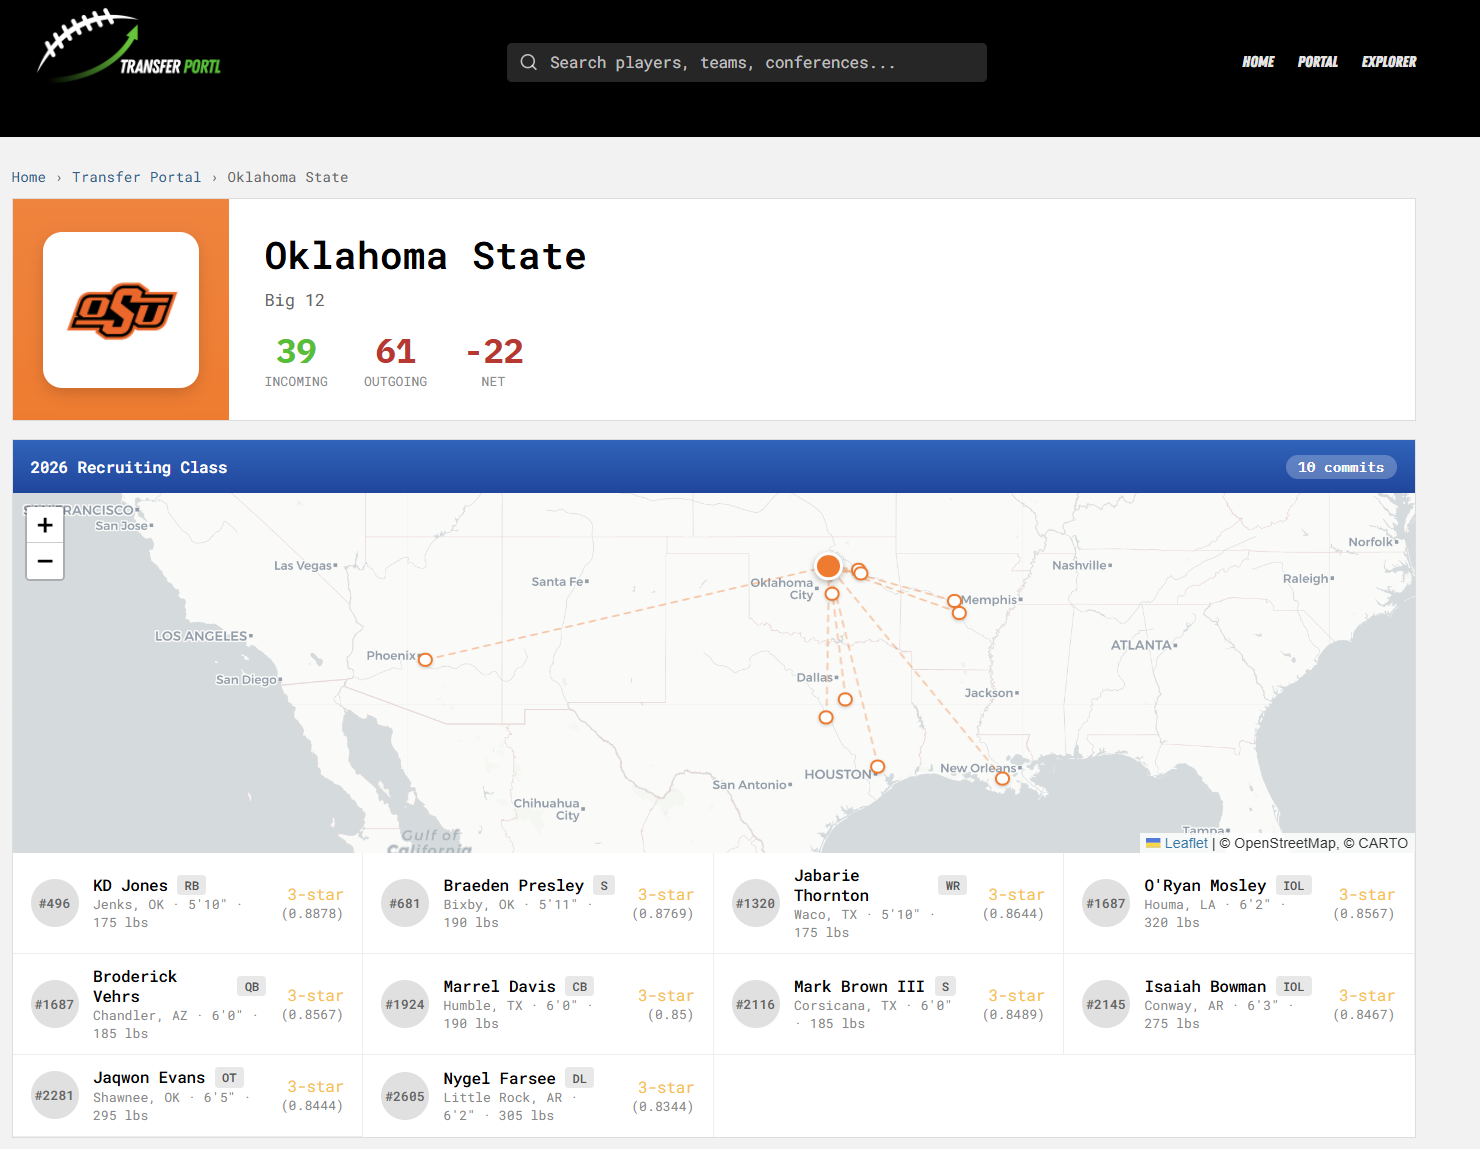
School pages that show a departures and arrivals tracker, as well as a high school commits map
Individual player pages detailing their stats, information, player representation links, and market value history
Team pages detailing staff directory changes over time and how those can impact predicted transfers, alongside a recent coaching changes table
An explorer tab for exporting data
A data edit request form for any data point you see
The Data
Mainly using CollegeFootballData.com’s API and the powers of surfing the web, I’ve been able to build a database of 30,000ish college football players and these stats:
Player stats
General game stats (pass attempts, receptions, tackles, EPA/play for specific positions, etc.)
High school recruit star ratings
Demographic information (hometown, high school, birthday, etc.)
Team stats
SP+ schedule rankings
Coaching staff directories to monitor staff changes
Wins, losses, conference championships, etc.
Using these sources, I a model with a few different steps to score and rank players. No fancy data visualizations this week since I spent all my effort learning to build a web app, but here’s the number of transfer portal entries every year since 2021 according to CFBD:
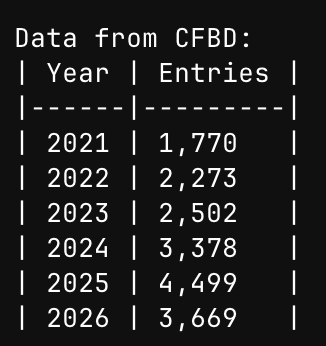
And we still have some time remaining in this 2026 portal.
Model Approach(es)
In the age where anyone can create a machine learning model, I think it’s really important to explain my steps thoroughly, and tell you all what I include in the model and what I don’t. I’m going to provide some given…use…to statements to convey in the simplest terms what I’m trying to predict. This is how we can currently define our Transfer Vulnerability Score (TVS):
Given historical transfer portal outcomes from 2021-2025 (14,416 portal entries: 71.5% transferred, 28.5% returned), use logistic regression to estimate transfer probability from core features (portal status, stars, position, conference, coach departures). Given the residuals from the logistic regression, use XGBoost gradient boosting to capture non-linear interactions (stars * entry timing, production * conference, coach departure * position depth) that the base model misses.
Rounding out out “smart” models, here’s a similar statement for NIL Value:
Given player production stats, recruiting ratings, years of eligibility remaining, and verified NIL contract data, use Bayesian regression to estimate market valuations, allowing the model to update incrementally as new contract information becomes available.
Things like the Portl Grade (a percentiles grouping), destination prediction (a set of rules), and coach/player loyalty scores (an assumption based on past coach job movement/frequency analysis) are our remaining, for lack of a better term, “dumb” models. These just aren’t entirely trained models yet. The idea with Bayesian regression is that someday, I’ll receive more non-QB NIL contract information to fold in.
After weeks of research, this is what I came up with. It’s multi-faceted. For players not yet in the portal, I want to calculate a TVS to see how likely they are to enter. For players inside the portal, I want to try and predict where they’ll land and for how much money. For established pipelines, I want to see if they stay strong beyond coaching staff changes, or travel with a head coach. The XGBoost model was chosen to create more interaction terms due to a small pool of data, but this is up in the air. I do feel guilty of just slapping a gradient boost on this thing, but I can always go back and tweak it later.
NIL Value
Market value is based on player production as well as high school star rating. High school star rating interacts in a way where it deteriorates over time, to try and account for scenarios where a 5 star freshman recruit who didn’t play much in his first year of eligibility should still be valuable, and to account for potential walk-ons (technically 0 star recruits) who go on to become prolific college football players. Players also receive boosts for things like individual accolades, conference championships, position premiums, etc. but it mainly relies on fitting players into specific buckets based on where they play and how they play. For player production data, I was able to procure play by play data from 2003 to today. All of this historical data isn’t viewable on TransferPortl, but it helped serve as the base for the math.
Transfer Vulnerability Score (TVS)
This is the model I’m most excited about since it includes context about player’s personal networks. The transfer vulnerability score is calculated based on a number of factors. It started with a heuristic and eventually turned into a math formula. I created a multi-ring buffer around college campuses to create a ‘player home team’ variable after noticing that hometown players tend to stick around through coaching changes or pre-conceived ‘rougher’ situations (lack of playing time, staff turnover, etc.) I’m also accounting for turnaround time in the portal itself. The longer a player stays in the portal, the more likely he is to return to his school. This dataset goes back to 2021, the beginning of the transfer portal era of college football.
Portl Grade
Last, I have assigned a grade to players in the transfer portal based on the aforementioned data points. I’m taking a weighted average of production stats, measurables, high school recruit ratings, strength of schedule, etc. to assign a grade to players.
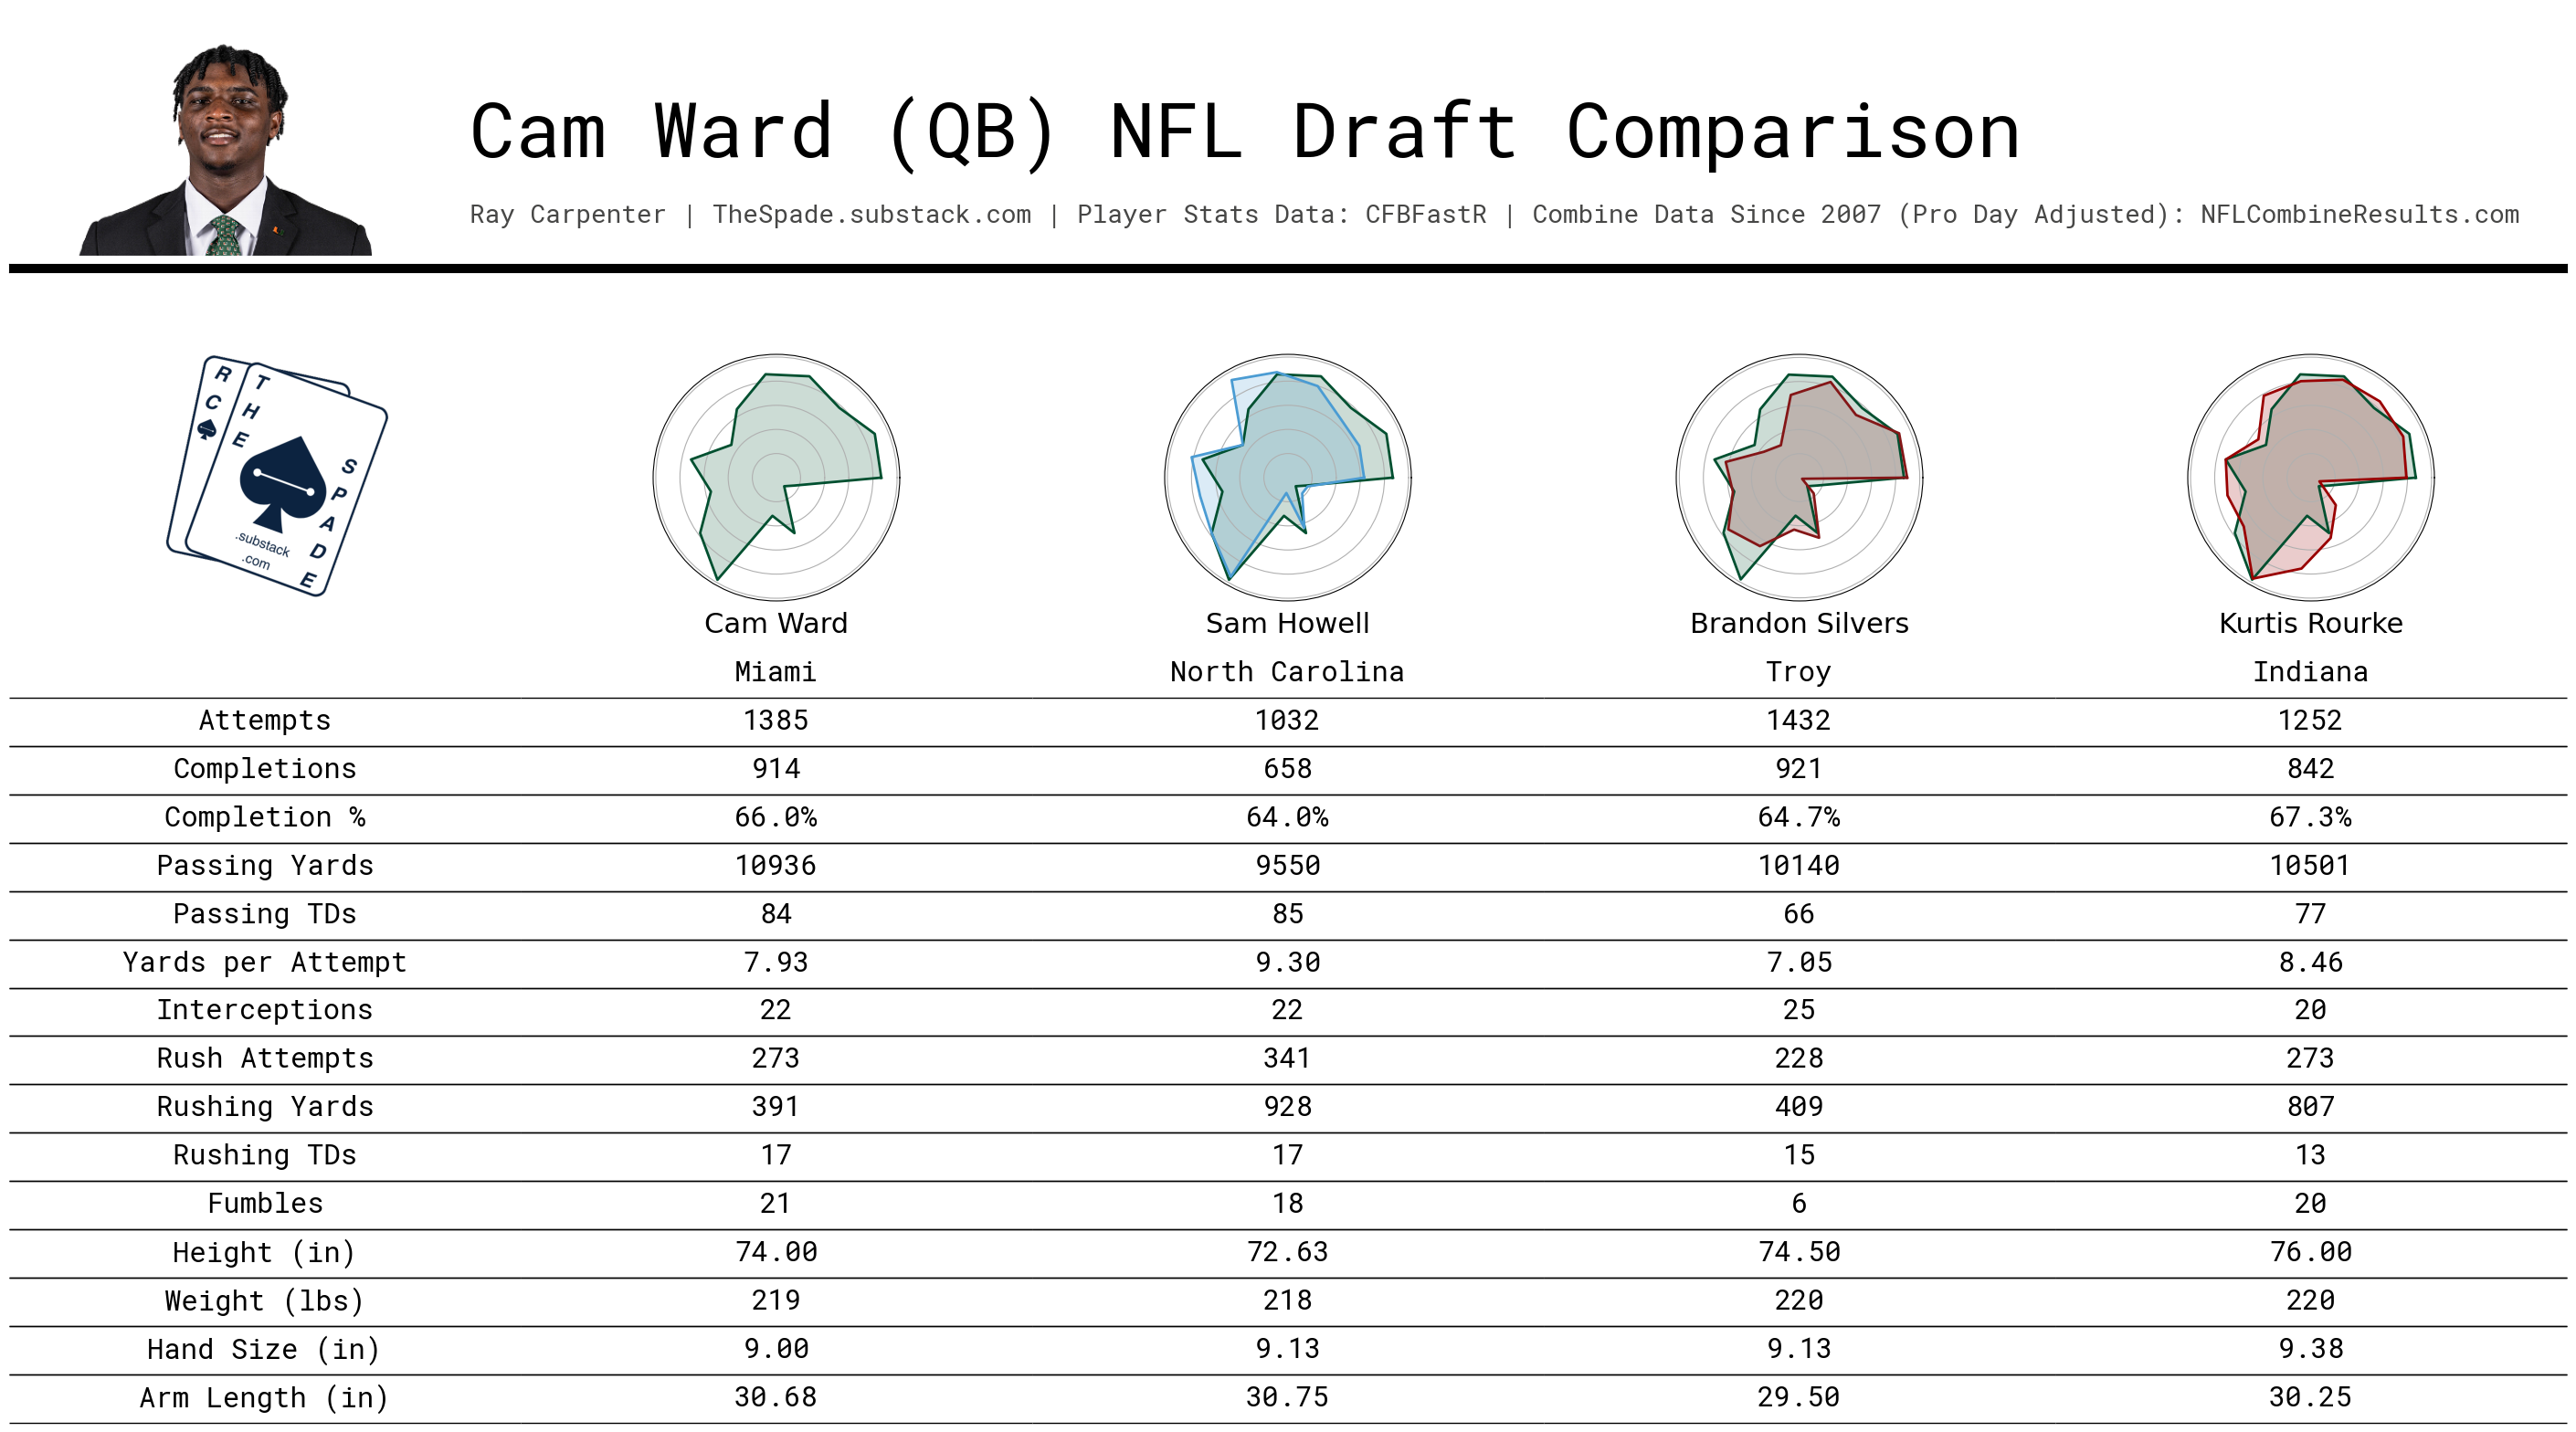
Here’s a throwback for you. My Portl Grade model is based off of my old NFL draft player similarity model. Remember this one? The short summary of that model is that I grouped players together into different positional groups, then created sub-groups based on production percentiles. It included draft combine information so I stripped that but kept the percentile groupings. Its original purpose was to find the 3 most similar draft prospects per player, but now I’m using it to create percentile grades on the site.
I think the best way to describe these three different scores is to show you some well-known examples.
Jeremiah Smith
Smith is our example of an A+ Portal Grade.
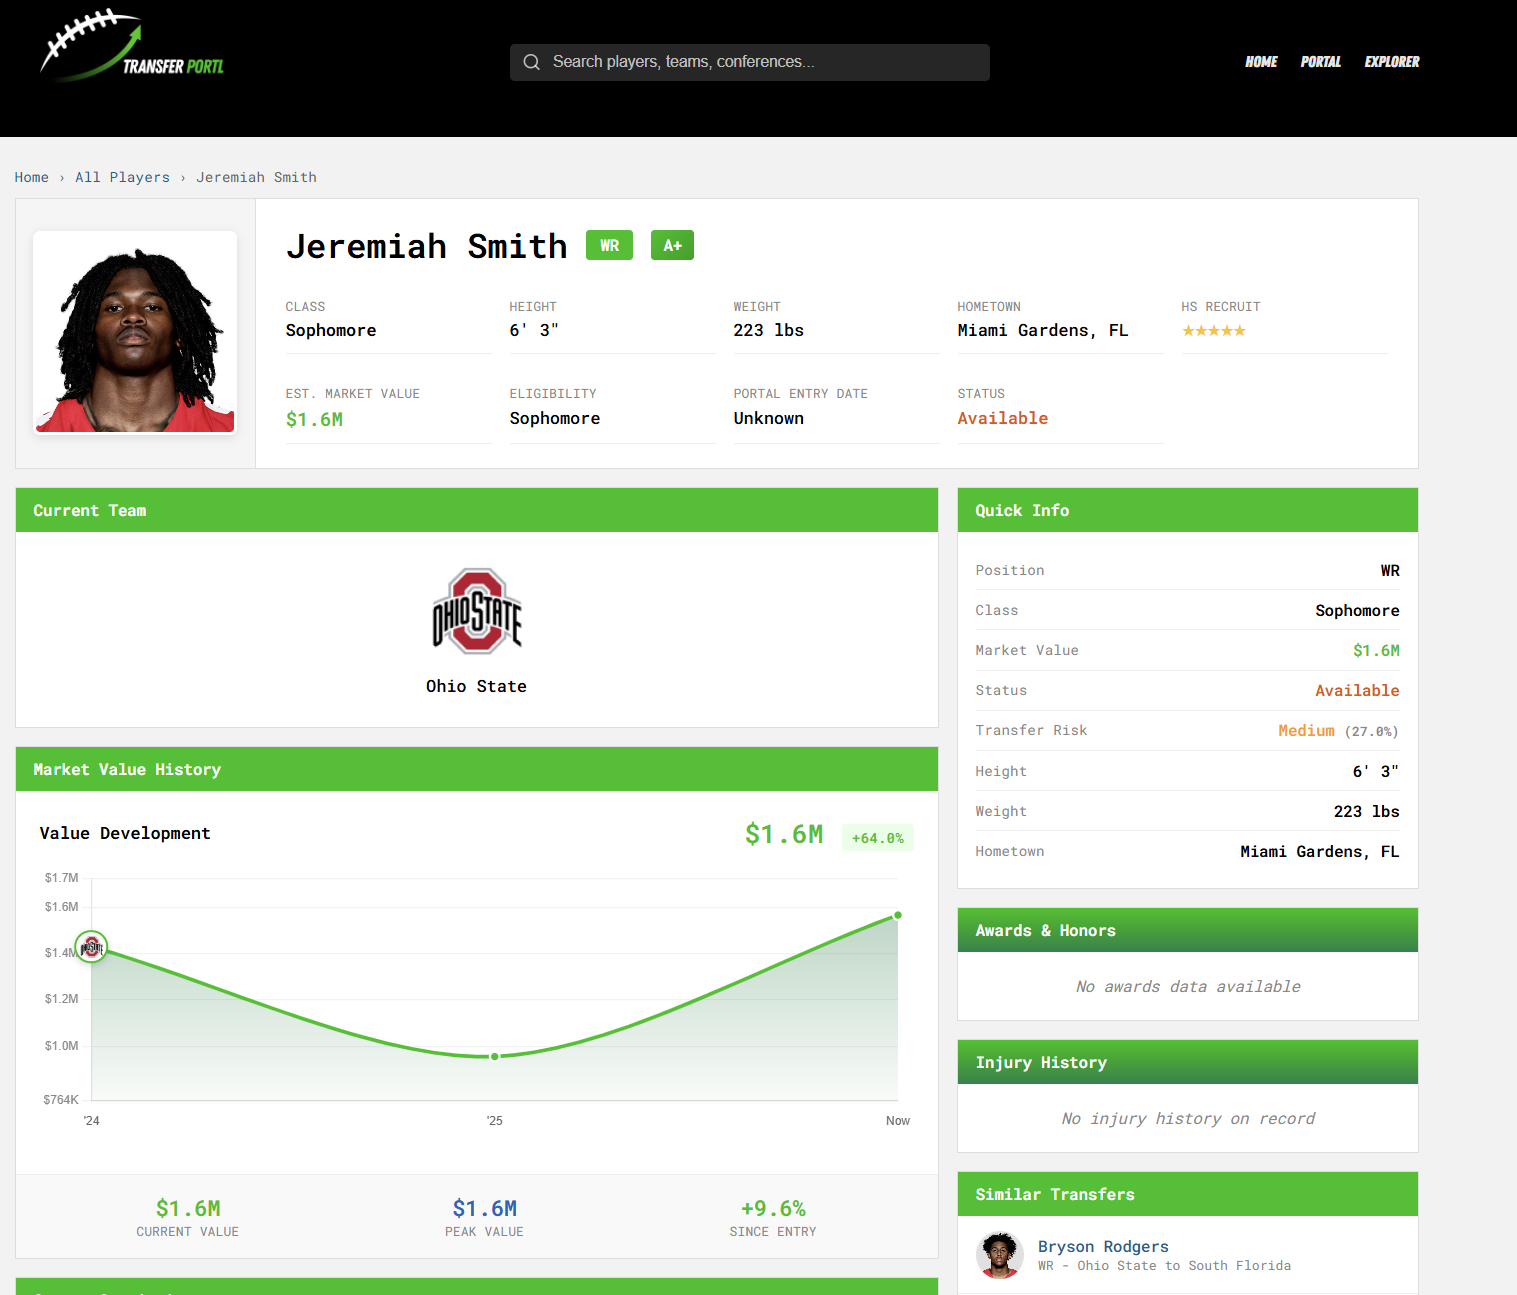
For all the reasons you might expect. Highly touted out of high school, highly productive, great measurables. His transfer risk is medium due to factors like Brian Hartline leaving, and the model interpreting his 2025 season as a ‘down’ one when compared to his 2024 season. However, the transfer vulnerability score is lower than someone just as good at another P4 school because Ryan Day is still in charge and based on history, players who play a lot at Ohio State tend to stay at Ohio State or enter the NFL Draft, not transfer. If Smith were to ever hit the portal, he’d absolutely receive more than $1.6 million, but you get the idea.
Drew Mestemaker
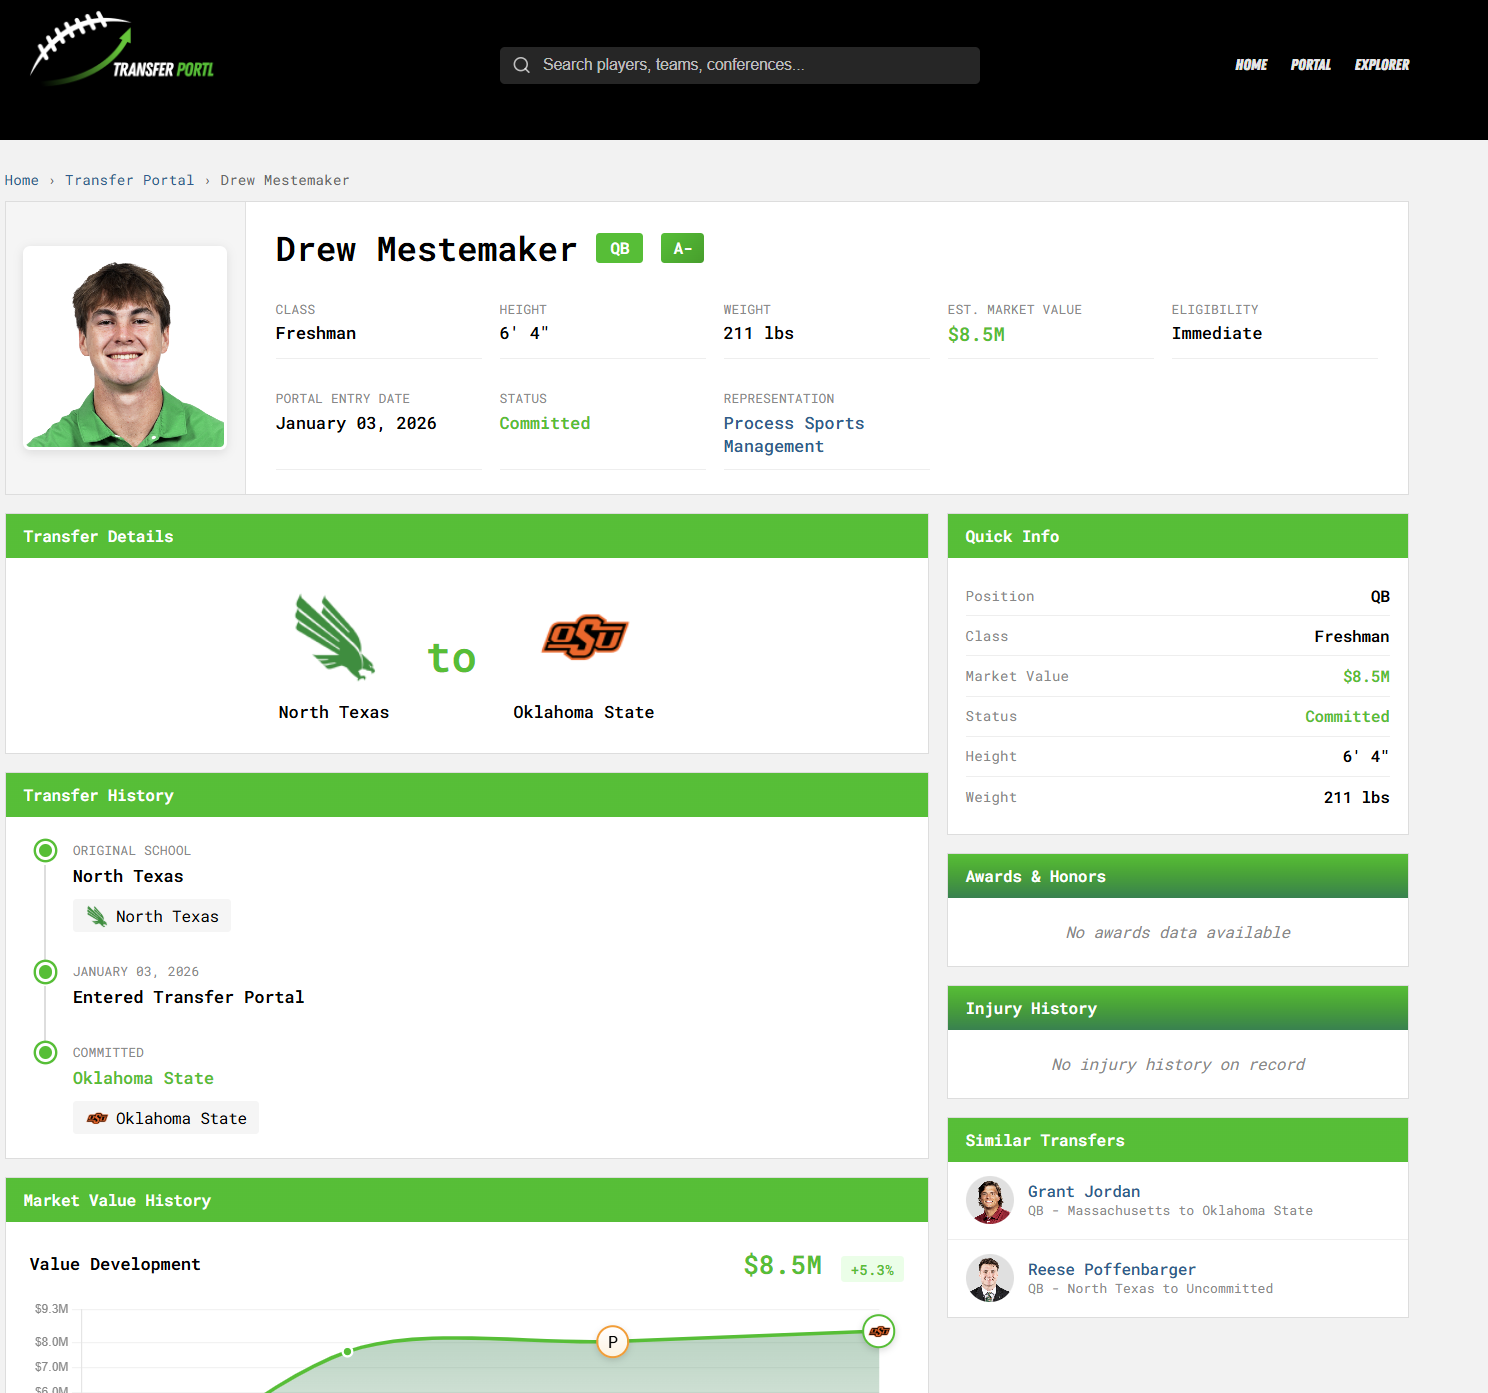
Mestemaker is our example for how the model will “replace” (for lack of a better word) low high school recruit status with proven college production. His market value is extremely high because he plays a premium position and his high percentile measurables and production scores from that premium position. His B+ grade is due to some schedule-weighted adjustments. Before committing to Oklahoma State, Mestemaker was listed as a high TVS player due to factors like his coach leaving for a P4 school and dramatically increasing his 2024 market value.
Jack Tchienchou
Tulane S Jack Tchienchou is seen as a high transfer risk:
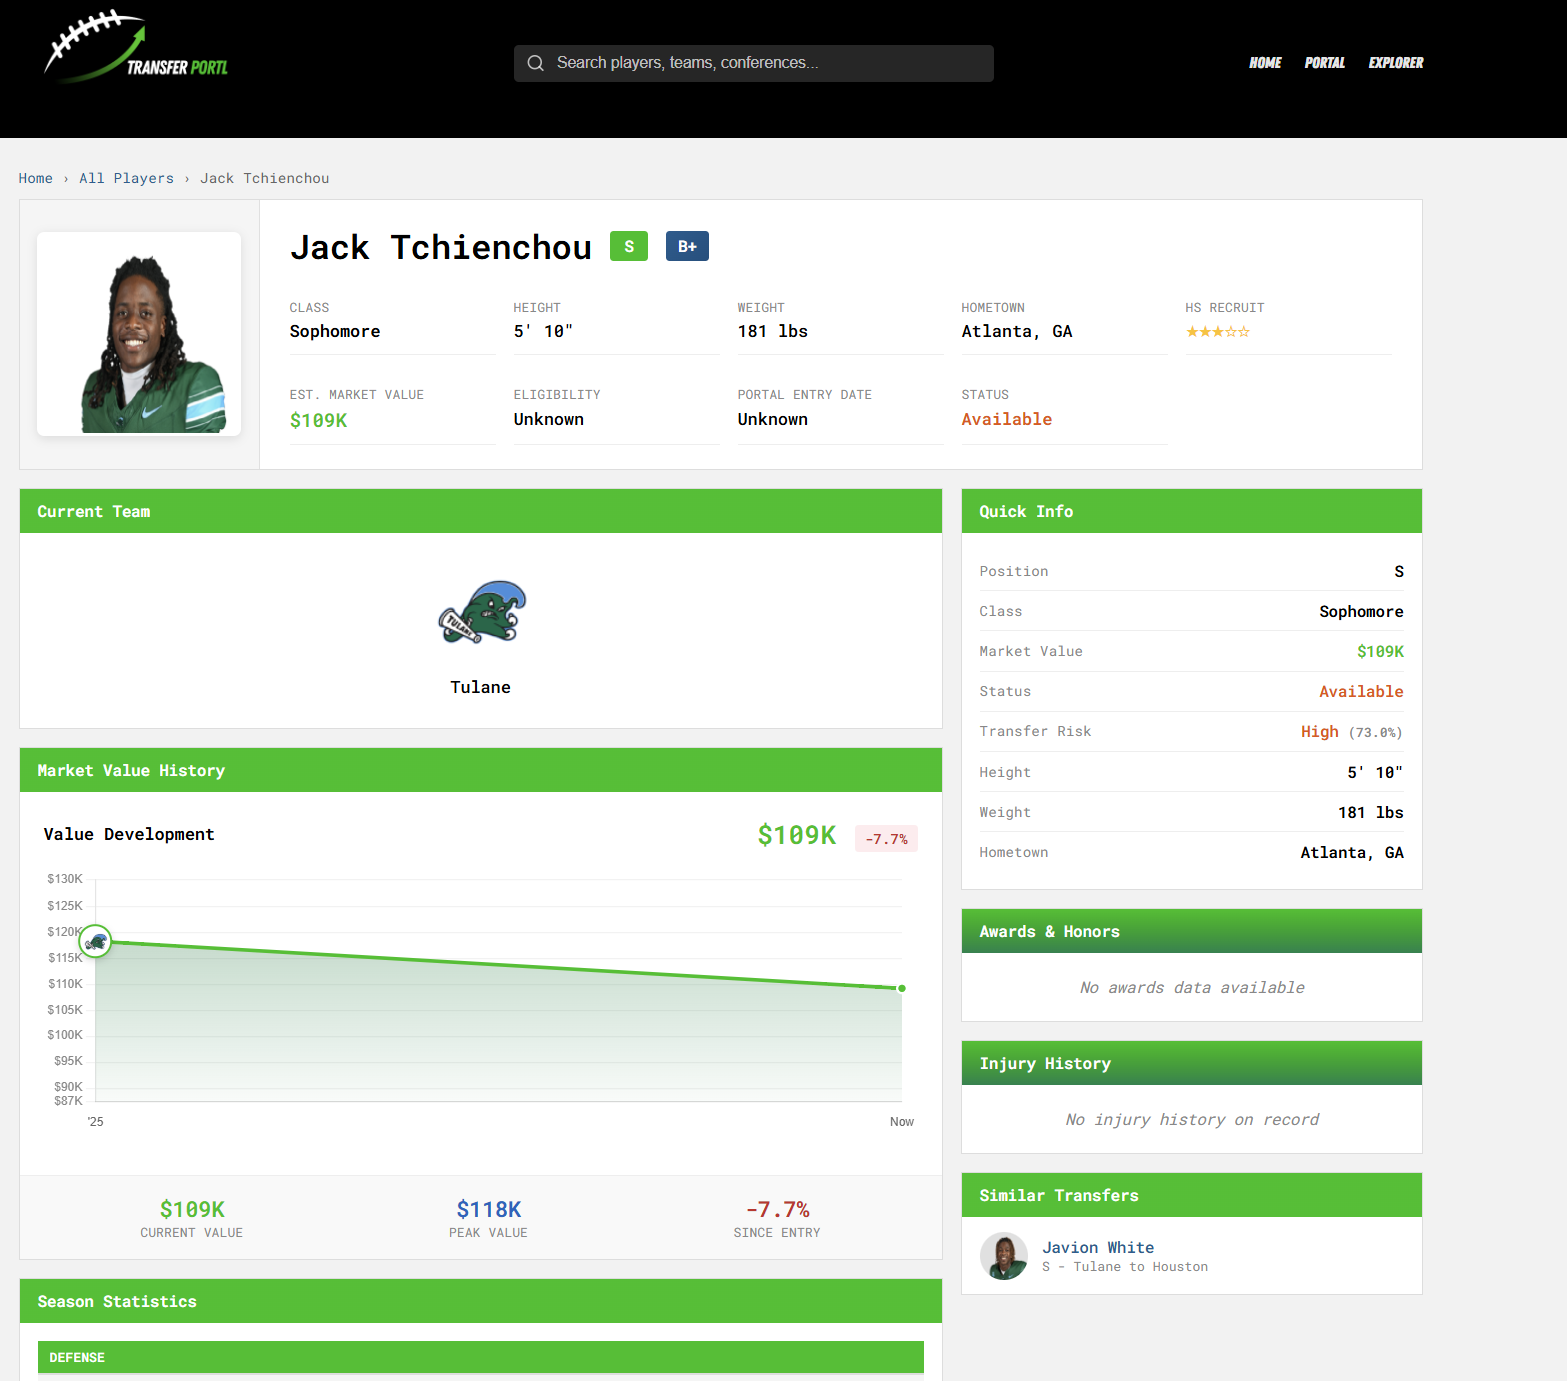
This is due to factors like his coach leaving for a P4 school and not having any roots based in New Orleans, and him having already followed John Sumrall from Troy to Tulane in 2023.
Limitations
Unlike other sports, football positions are highly bucketed. We have more data available to us on quarterbacks than offensive linemen and that will remain the case for the foreseeable future. You’ll observe grades, market values, and transfer vulnerability scores that feel ‘better’ for positions that have more tracked metrics, like QBs, RBs, WRs, and EDGEs. The kicker and offensive line departments are currently lacking due to relying more on less data. There are other subscription-based datasets I could bring into the fold soon, like PFF grades or data from SIS. But football individual metrics are few and far between especially for positions that don’t carry the ball for yards or score touchdowns. I made a major change after the first release on Tuesday, January 13th to ‘soften’ the measures I put in because I felt the claims were too strong given the dataset I used. This is an iterative process and I'll make some improvements soon. Just like I said before, I felt the rush to get this out before the portal closes.
Also, the hometown factor is a SQL COALESCE() of a player’s hometown and if it’s not known, using a player’s high school city as a substitute. For some players this is fine, but I know some players travel very far to play high school football. I’m not sure I’ll ever be able to properly loyalty context though. There are tons of Michigan alumni who live in Columbus. Just because their son went to high school in Canal Winchester doesn’t mean he’d choose the Buckeyes over the Wolverines. Still though, I can go back and iterate over these parts later.
On the bright side, there is a never-ending pool of new college football players entering the transfer portal and coaches accepting new jobs.
Tech Specs
For my fellow industry professionals here, I entered this project highly skilled in certain areas and new to certain areas. My background in model building, feature store creation, and data pipelines helped me quickly standup a SQLite database to hold these various sources of information, as well as a PDF parser for college football staff directories.
For the areas I wasn’t familiar with like web development, I found success in hosting this website on Digital Ocean and creating it as a Flask app. DO directly syncs with the GitHub repository I made this website in and makes deploying the app easy. You may be asking yourself, like I did, “Why did you choose SQLite over DuckDB?” The answer is that I was running into package dependency errors with a DuckDB database that weren’t worth the millisecond loading speed difference between it and SQLite, causing data sync issues. An older database instance would bulldoze the new data with a cached state on auto-refreshes making my data appear out of sync. This was my first time trying to use DuckDB for something enterprise-ish instead of a personal project and I was left slightly disappointed by it. If I wasn’t rushing to get this website out (the portal window closes in 4 days!) I would’ve spent more time investigating. And for the math-leaning folks reading this, my TVS model is currently sitting around a .73 AUC, with hopes that future data can improve this. Through completing this project, I’m learning why people don’t do SQL-first development when building websites. I have a much more profound respect for front-end engineers than before.
Future Projects
In a haste to release this site before the transfer portal window closes, I’ve focused on the math, models, and data collection. Later on, I’d like to include more UI features such as coach behavior tracking and recruit patterns. Do strong recruiting pipelines carry over with coaches or persist through hiring and firing cycles? What coach could be dropped into a situation perceived as completely foreign to them (no staff connections or geographic ties) and succeed? Assigning grades to coaches is on the roadmap. The whole coaching aspect of the website is something I’ll work on in the coming months. Along with this will be a never-ending cycle of data collection and correction. All of the data is in there, I just am having trouble with the front-end UI. The front page and ‘explorer’ tabs work better than the individual player pages, and I need to finish building it out. I’m still brainstorming the best ways to show different player stats over time. To export any data, use the ‘Explorer’ tab. I’ve also built areas for injuries and awards, but haven’t imported that data yet.
The search bar continues to be a puzzle I can’t crack (players listed as in the portal who are already committed, font mix-ups) but it functions well enough for now. Individual player slugs are easy to interpret if you want to bypass it.
I think this site can serve as an information source for college football staffs a) looking for new players or b) seeking information on how their competitors strategize in the transfer portal and recruiting markets. This is still a work in progress, but I started collecting class of 2026 commitment data as well for each team:
Feel free to check it out here, and let me know what you think. I’d love to hear any and all thoughts on this.
Release Notes: Wednesday January 14th, 2026
Thanks everyone for all of your feedback! I went ahead and made some changes based on it.
Added a (Beta) next to the “NIL Value History” graph to emphasize how it’s still a work in progress.
All service academy players now show as 0 TVS.
I was running into an app error due to my API data refresh for the site’s daily transfers messing with manual overrides I have to correct data on the backend. I resolved these with a new staging table in SQLite.
Removed reds from values to reduce negative connotation(s).