
Visualizations About the 2009 'Cash For Clunkers' Car Trade-In Program
Oh, you thought we only covered sports around here?

I hope everyone had a wonderful 4th of July weekend. The weather was perfect at the shore and I took advantage of it with lots of swimming, tanning, and beachcombing. But of course we’re running a normally distributed analytics newsletter over here so I wanted to make sure I gave my faithful readers another piece to chew on this week.
This week we’re going to cover something a little different. I am still working hard on some football themed data projects that I can’t wait to share with you all but I was heavily sidetracked by an intriguing dataset. The gist of it goes like this: For weeks I’ve been trying to think of a use case for a Sankey diagram in the realm of NFL or CFB data but couldn’t fit one to a dataset. However I stumbled across this YouTube video from last year made by a channel called The Drive that details the Obama-era Cash for Clunkers vehicle trade-in program from 2009. This video led me down a rabbit hole to The Drive’s Blog where they published a summary dataset of each vehicle traded in during the program. Following another link on that blog brought me to a page hosted on The Internet Archive from the National Highway Traffic Safety Administration (NHTSA). This link led me to a text file with a line item for each and every vehicle trade-in that happened during the Cash for Clunkers program, showing every single vehicle that was traded in and which vehicles those customers bought with their trade-in money. All I had to do was save this txt file as a csv and boom, I now have a working dataset of over 677,000 vehicle transactions from the year 2009.
I thought this could be perfect for a Sankey diagram so that’s what you’ll see today on The Spade. Spoiler alert: I am about to show you a heartbreaking list of almost extinct vehicles. This Cash for Clunkers program did a lot of good for the US, but it also accelerated the extinction of some great vehicles.
If you ever watched Top Gear then you’ll get this reference. Today, this newsletter isn’t The Spade. It’s The Stig.

I promise we’ll be back to our regularly scheduled football analytics programming next week. Thanks for taking this detour with me.
Play Jessica by the Allman Brothers Band!
What is Cash for Clunkers?
The Car Allowance Rebate System (CARS) was a US federal program to promote cleaner, newer, greener cars. The federal government would give you a whopping $4500 to trade in your old fuel guzzling ‘clunker’ in exchange for a more fuel efficient car. The program ran from July 1 to August 24, 2009. Over 677,000 old vehicles were scrapped during this summer. The program was so popular that the government estimated the allocated $1 billion in handouts would be filled by November 1, 2009 but the program exceeded that number on July 30. In response, Congress approved another $2 billion for the program that only brought its lifespan to August 24 in the same summer.
Here’s the checklist your ‘clunker’ had to meet to qualify:
Your car had to be less than 25 years old. So made between 1984 and 2009
Your car had to get less than 18 miles per gallon on the road
If you met these standards, the government gave you $4500 for it. That’s about $6,742 in 2025 adjusted for inflation. In response, your new car purchased with this trade-in had:
A maximum value of $45,000
A minimum fuel economy value of 22mpg
What did the government do with your old car once you traded it in? They crushed it, or filled the gas tank with a sodium silicate solution, ran the car until it stopped running, then crushed it. Your old car was turned obsolete. To learn more, check out this Wikipedia page.
Car Stats
The most commonly traded in vehicle during the summer of 2009 was the Ford Explorer 4WD. A whopping 40,000 Ford Explorers were traded in. The second most traded in vehicle? A Ford F-150 2WD pickup truck, with 31,261 of those traded in. I guess drivers were tired of fixing or repairing daily.
The rest of the top 10 goes as follows:
Jeep Grand Cherokee (24,576)
Ford Explorer 2WD (20,086)
Jeep Cherokee 4WD (19,344)
Dodge Grand Caravan 2WD (19,243)
Chevy Blazer 4WD (15,546)
Ford F-150 4WD (14,126)
Chevy C1500 Pickup 2WD (13,938)
Ford Windstar FWD Van (11,794)
That’s a lot of American cars coming off the road. What about the most popular purchased vehicles with these rebates? That list goes:
Toyota Corolla (28,870)
Honda Civic (26,891)
Toyota Camry (24,766)
Ford Focus FWD (21,730)
Hyundai Elantra (17,257)
Nissan Versa (15,205)
Toyota Prius (14,742)
Honda Accord (12,235)
Ford Escape FWD (12,114)
Honda Fit (12,104)
I was surprised to only see two American cars on the top 10 newest vehicle list.
The most common trade in to new car path taken was actually for the same car. There were 437 instances of trade-ins of a 1994 Ford F-150 2WD traded in for a 2009 Ford F-150 2WD.
Catastrophic Car Casualties
Someone in California traded in a 1991 BMW M3 for a 2010 Toyota Prius.

If you’re a Frank Ocean fan, you might recognize this car.

I found 5 listings on CARFAX of this M3 for sale, ranging between $79,000 and $129,900. The 2010 Prius goes for much cheaper. According to the data, this car was crushed.
Someone in Florida traded in a 1999 Mercedes C-Class AMG for a 2009 Subaru Forester.

This car’s listed disposal status in the data is “No Entity” so maybe it’s still out there.
Anyone here a fan of the sitcom How I Met Your Mother? 61 Pontiac Fieros (Marshall’s car that had one tape stuck in the deck) were crushed or scrapped during the CARS program.
122 1985-95 Chevrolet Corvettes were traded in. 202 El Caminos were traded in as well, alongside 980 Camaros. These cars went to the scrapyard alongside 1,566 Ford Mustangs and 4,898 Ford Broncos.
The most crushing (no pun intended) vehicle extinction of all during this summer was the Toyota Land Cruiser. Exactly 899 Land Cruisers were taken off the road in the summer of 2009 and here’s the vehicles they were traded in for. First, let’s look at the 80s Land Cruisers:
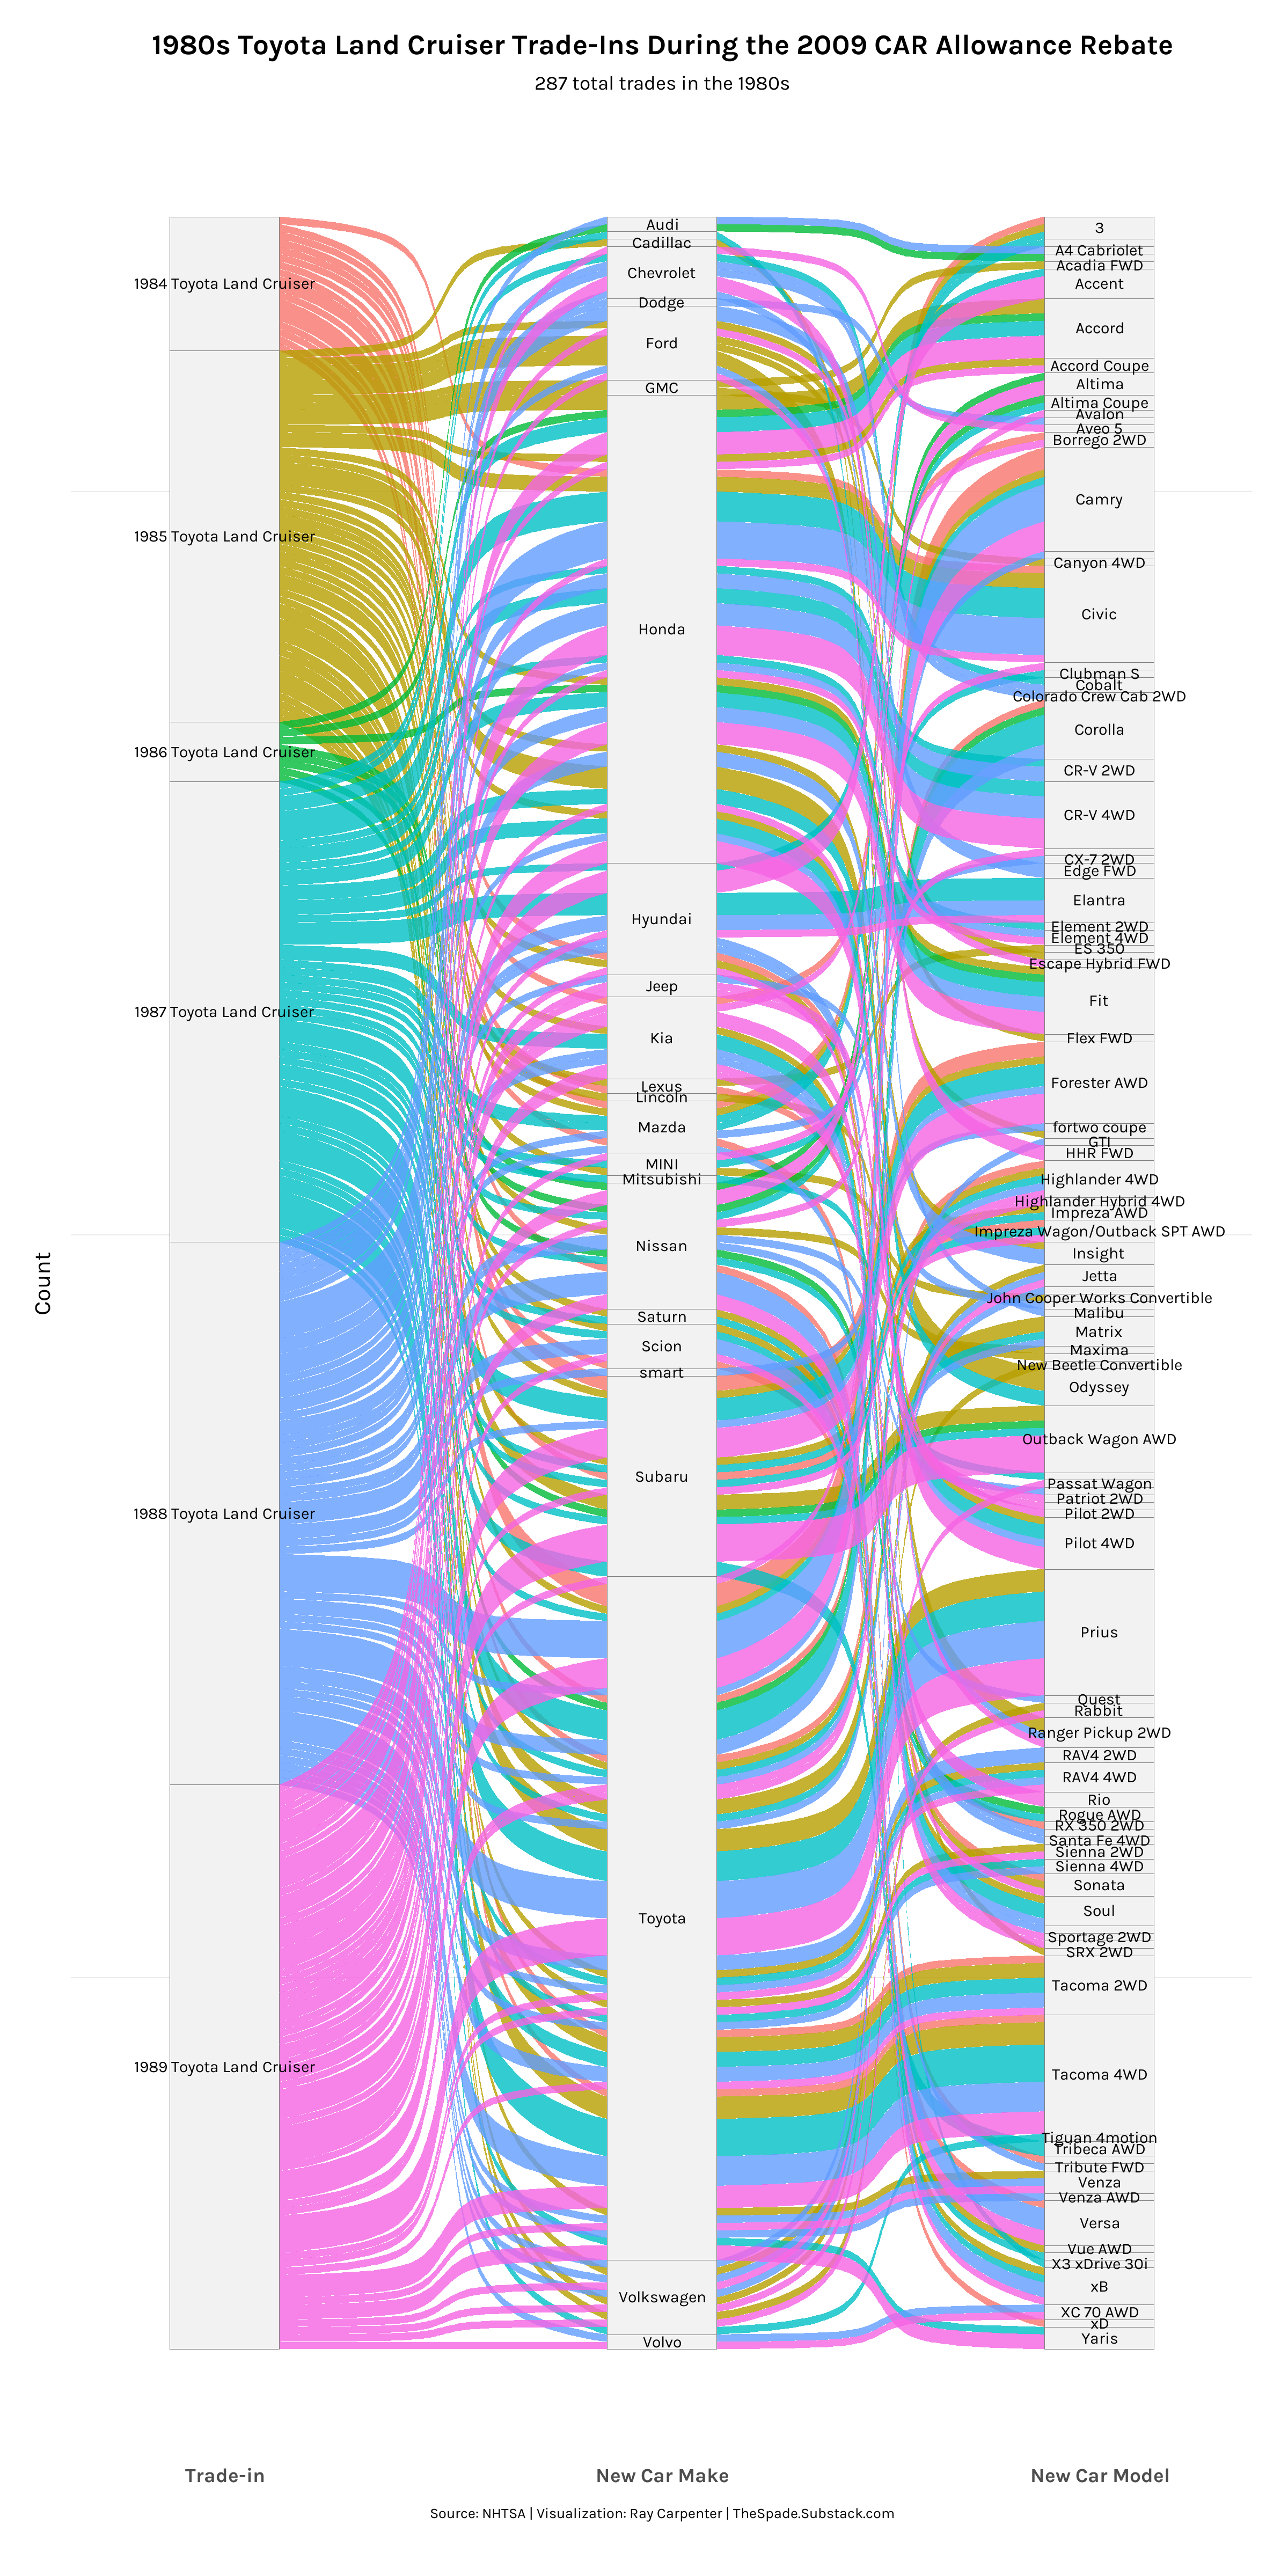
I would say the most tragic loss in this bunch was the 1984 Land Cruiser, pictured below:

Here’s the chart for the 90s Land Cruisers:
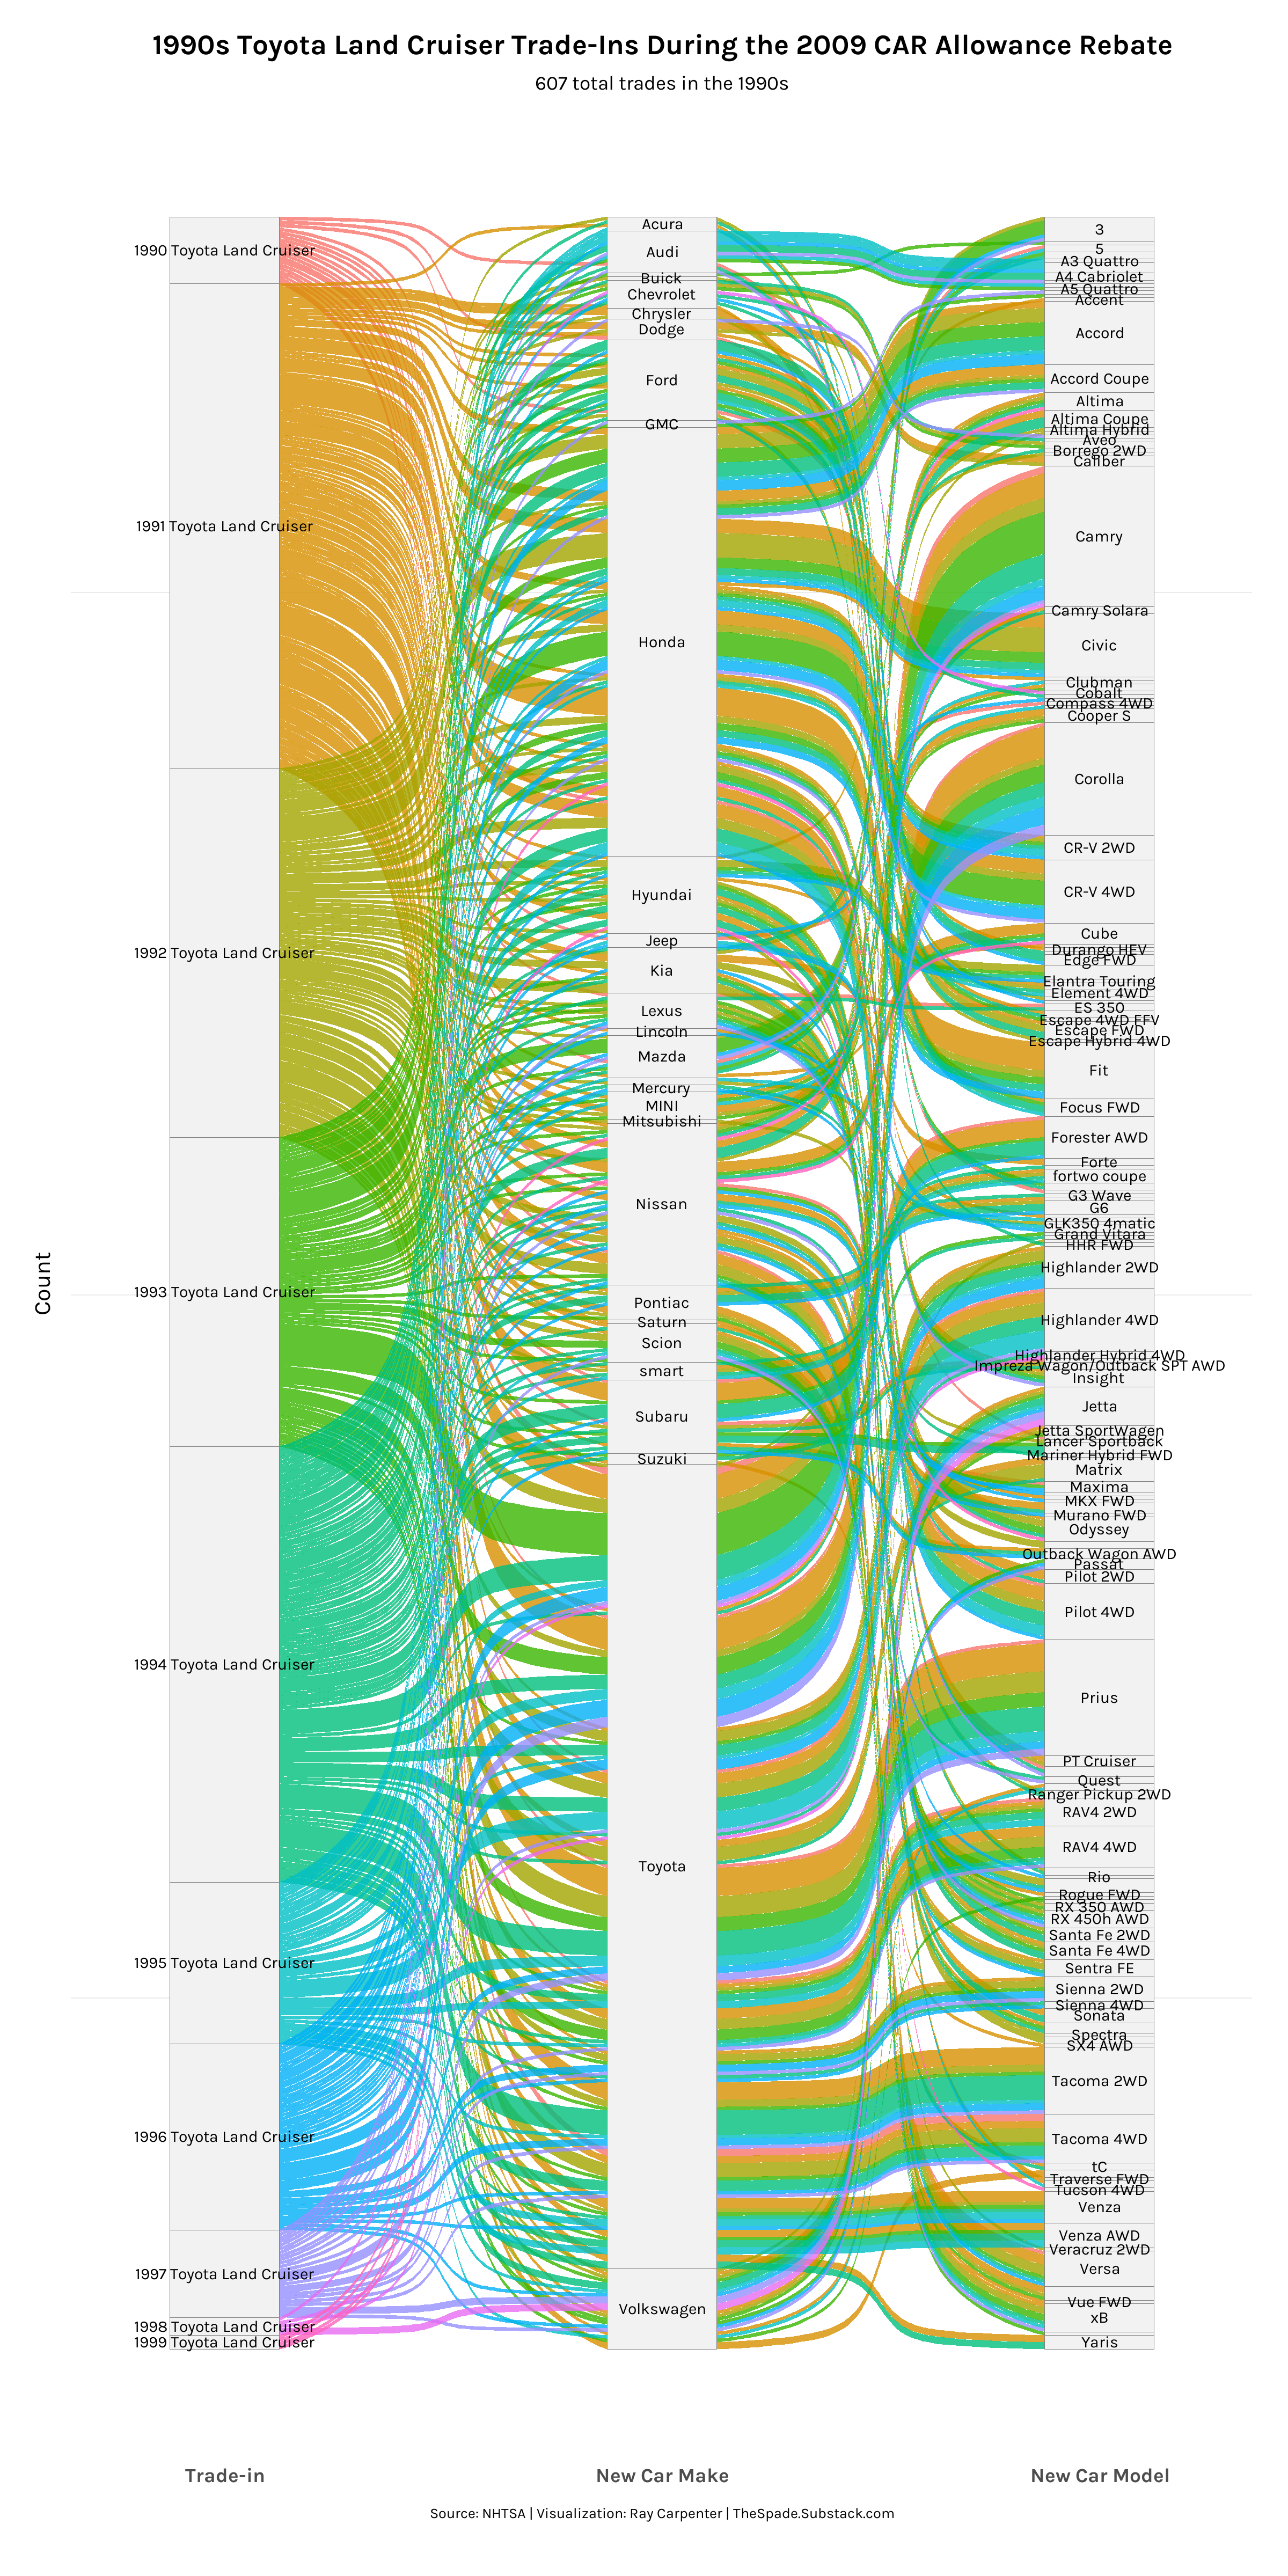
Here’s a 1994 Land Cruiser Wagon:

And last but not least, the 2000s chart:
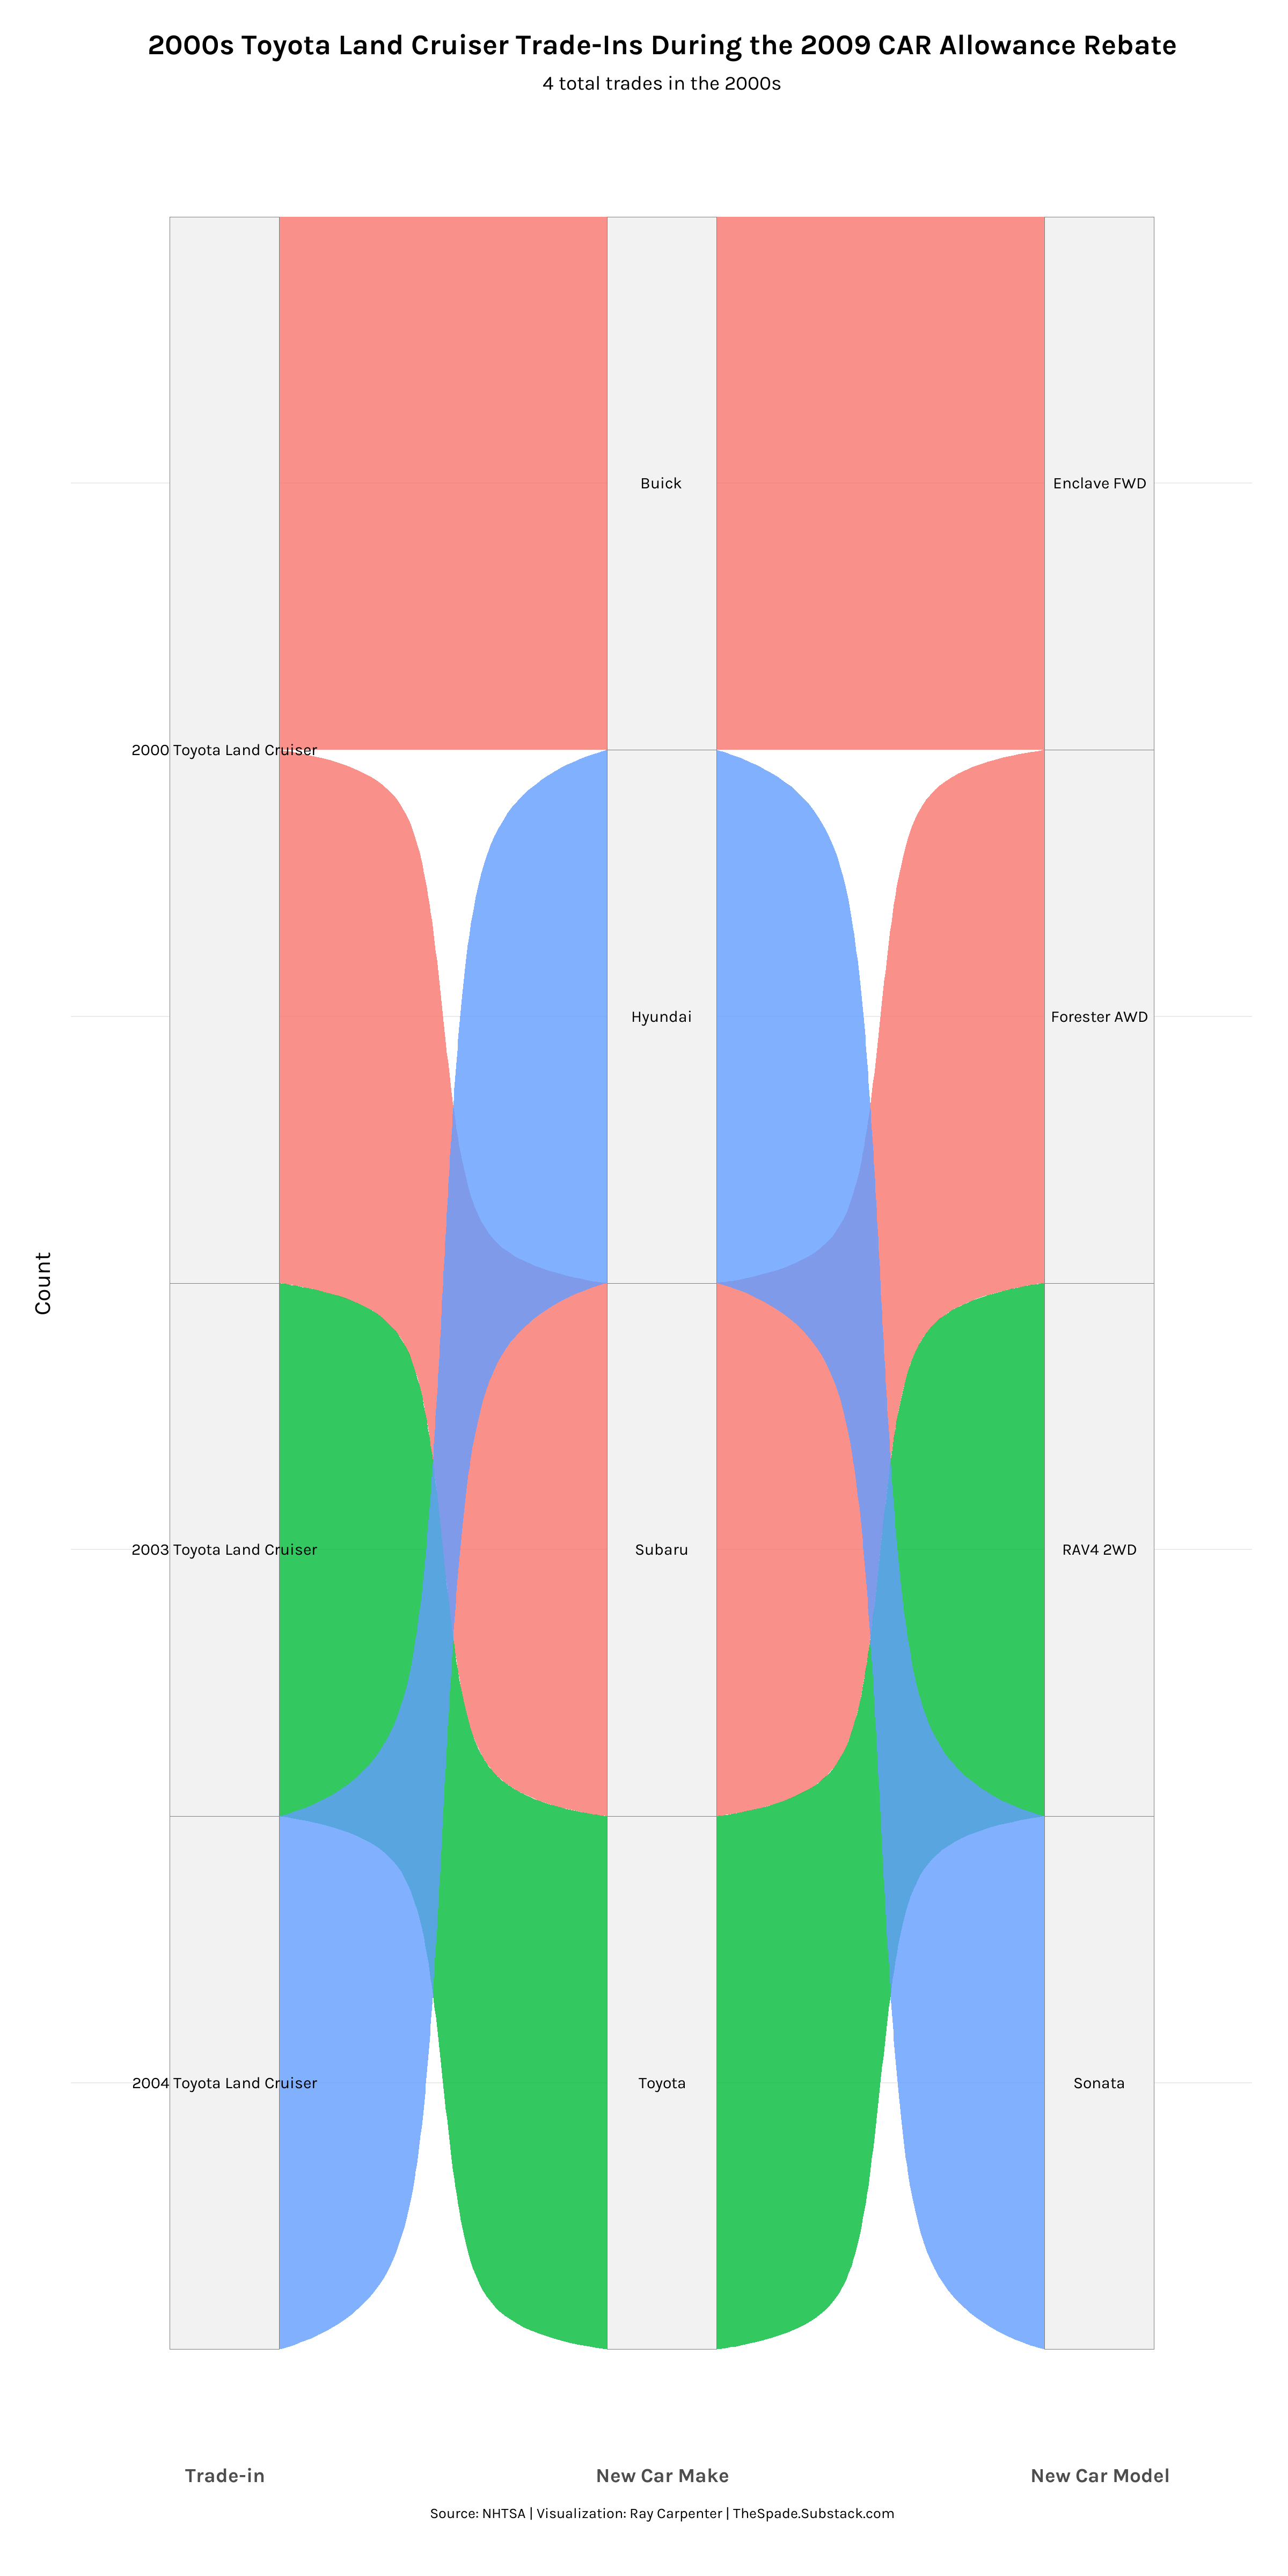
Only 4 2000s LCs were traded in, but here’s a photo of a 2000 LC:

That’s about all I have for today. Let me know your thoughts in the comments below!