
Regularized Adjusted Plus-Minus (RAPM) Metrics For NFL Players
Diggs-ing up some more advanced metrics

Good morning everyone,
It’s the NFL off-season and we’re heading for an amazing March Madness. If I had to explain why I’m on a basketball kick again, those are probably the two reasons why. And of course, the endless pool of knowledge in the world of basketball analytics. A couple of weeks ago, I attempted to calculate NFL on/off stats since nflreadR released their snap participation data for the season and freed me from the shackles of web scraping. That was me dipping my toes in the shallow end of basketball analytics, and this week’s edition is me diving head first into the deep end. We’re going to attempt to apply an NBA stat called Regularized Adjusted Plus-Minus (RAPM) to football.
You may be asking yourself, what is adjusted plus-minus? Jeremias Engelmann did a better job explaining it than I ever could here, and here. The gist of adjusted plus-minus is that it’s a stat trying to measure the impact of individual NBA players. Plus/minus ratings don’t exactly translate perfectly to NFL play, but that’s never stopped us from exploring the topic before.
The Spade is a weekly football analytics newsletter covering the NFL, college football, and everything in between. Lately we’ve been focused on the landscape of the college football transfer portal and applying NBA stats to the NFL. In the coming weeks, I’ll be publishing some NFL draft content. If that stuff sounds interesting to you, I’d love to have you along for the ride as a subscriber for free:
There’s a paid option as well if you’d like access to my coding tutorials for R, Python SQL, and soon, D3. Let’s dig up some more football data visualizations.
Inputs
We’re using nflreadR’s participation data back from 2016 until now to grab snap participation data and merge it to play-by-play data that has all the good stuff we’re looking for, like Expected Points Added (EPA) per play. Like NBA RAPM, we’re applying heavier weights to more recent data. That’s just a fancy way of saying that good play in 2025 matters more than good play in 2019. I got that idea of recency decay from this paper by Joseph Sill, and applied something similar. I was messing with concepts of exponential decay back when we were predicting the Super Bowl winning Gatorade Shower color.
I chose a ridge regression for version 1 of the NFL RAPM equivalent. Per 100 plays, I want to try and quantify how much each player contributes to each play’s EPA. The ridge portion of this pulls everyone’s average down towards zero, to try and avoid the classic pitfalls of the NBA’s RAPM like over-valuing a player who doesn’t play many minutes at all. This was intended to reduce crazy outliers, like an offensive lineman who was on the field one time over 17 weeks for a play that just happened to be a touchdown.
What I’m not including here is a raw table of the +/- ratings because those were just repeats of the raw EPA/Play on/off numbers from two weeks ago. More on that here.
V1 Results
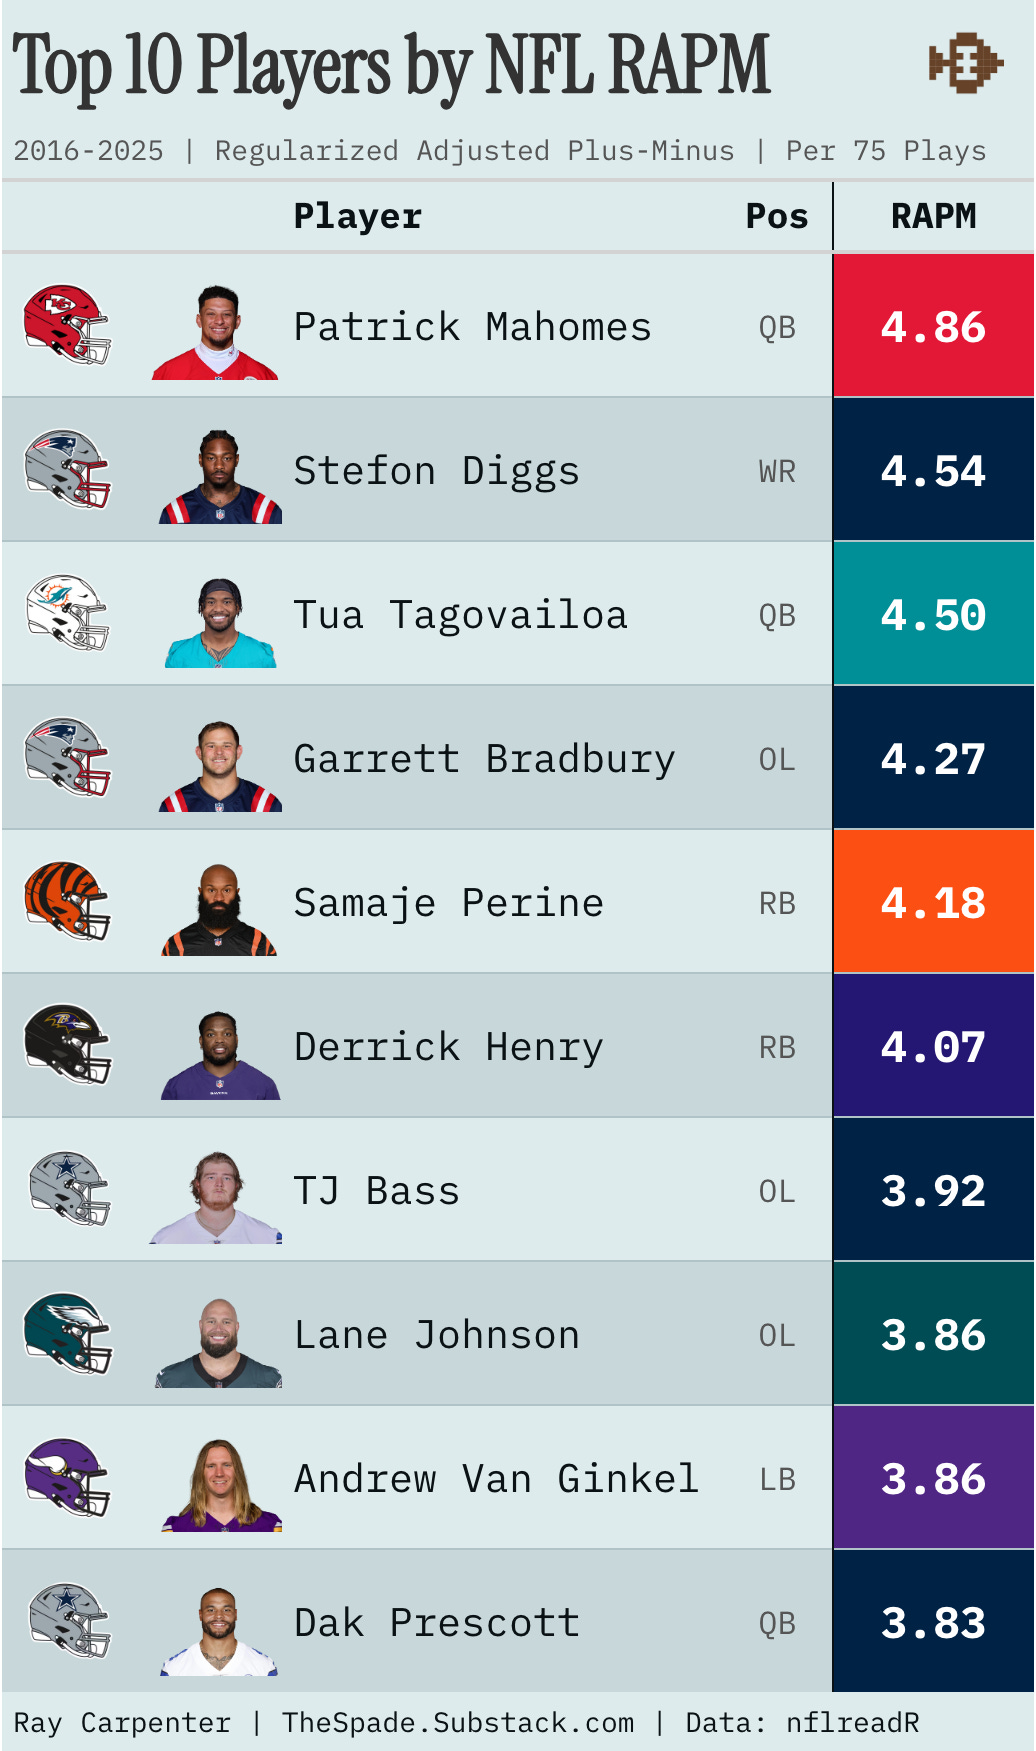
Here’s a table of version 1 of NFL RAPM for just the 2025 season:

I wanted to share some thoughts on this as well as shout out some folks who gave me some really good feedback:
I think this original model liked Stefon Diggs a lot because he was one of the only players in almost every participation dataset since 2016. Also, it favors Diggs because he jumped from high-flying offense with Buffalo to high-flying offense with New England. This told me I had some work to do regarding prior weights and trying to quantify individual position contribution.
Originally I had positive numbers for offensive players and negative numbers for defensive players. NBA players play both offense and defense so it’s a little easier to create three different buckets for them - offensive RAPM, defensive RAPM, and general RAPM. I chose ‘per 100’ just as a generalization to match the NBA’s per 100 possessions. My friend Ted let me know that this was based off real math though, that the average NBA game has roughly 100 possessions. And he also let me know the average NFL game has roughly 153 plays in it. For the sake of round numbers, I chose to scale to 150 plays as a trial run for version 2, but then a twitter follower of mine who simply goes by ‘Jonny’ said I should try cutting that in half since most NFL players (sans trick plays and Travis Hunter) only play one side of the ball. His profile picture is Tony Soprano, so I trust him completely and fully.
This original measure is extremely inflating Tua Tagovailoa because of the poor quarterback play that happens down in Miami when he misses time. In fact, I think this whole v1 measure is actually favoring those who miss significant time with injuries. Sam Laporta, Dak Prescott, Patrick Mahomes, Tua, Stefon Diggs, and Ronnie Stanley have all had extended stints on IR.
Another shoutout to Steven Patton who sent me down the nflWAR rabbit hole. He helped me do some EDA on quantifying positional value and contributing WPA to said positional value.
Benjamin Robinson pointed me towards Kevin Cole ‘s Unexpected Points, which also provided some valuable insight. You should go check out Ben’s mock draft content and Kevin’s on/off stats too.
I ended up scrapping this one for a v2 described below.
V2 Results
I took all of this feedback into consideration and re-ran a version 2, scaling to 75 plays instead of the arbitrary 100 and using win probability added combined with expected points added. Here are those results:
So this one here still likes Stefon Diggs, Tua Tagovailoa, and Patrick Mahomes. This one might actually be slightly more suspect though, since TJ Bass played fewer than 400 snaps for the Cowboys this season. This is another cumulative table using all of the data, but inclusion of players that only played in 2025 signals to me that maybe I’m weighing recency a little too much. This one here combined two different regressions, one for WPA and one for EPA and I used a z-score for both, to scale the data onto the same plane since those two numbers can vary. Z-score just means ‘standard deviations above average.’ This also attempts to discount garbage time contributions through EPA by taking into account the win probability spread. That being said, this still isn’t exactly where I want it to be.
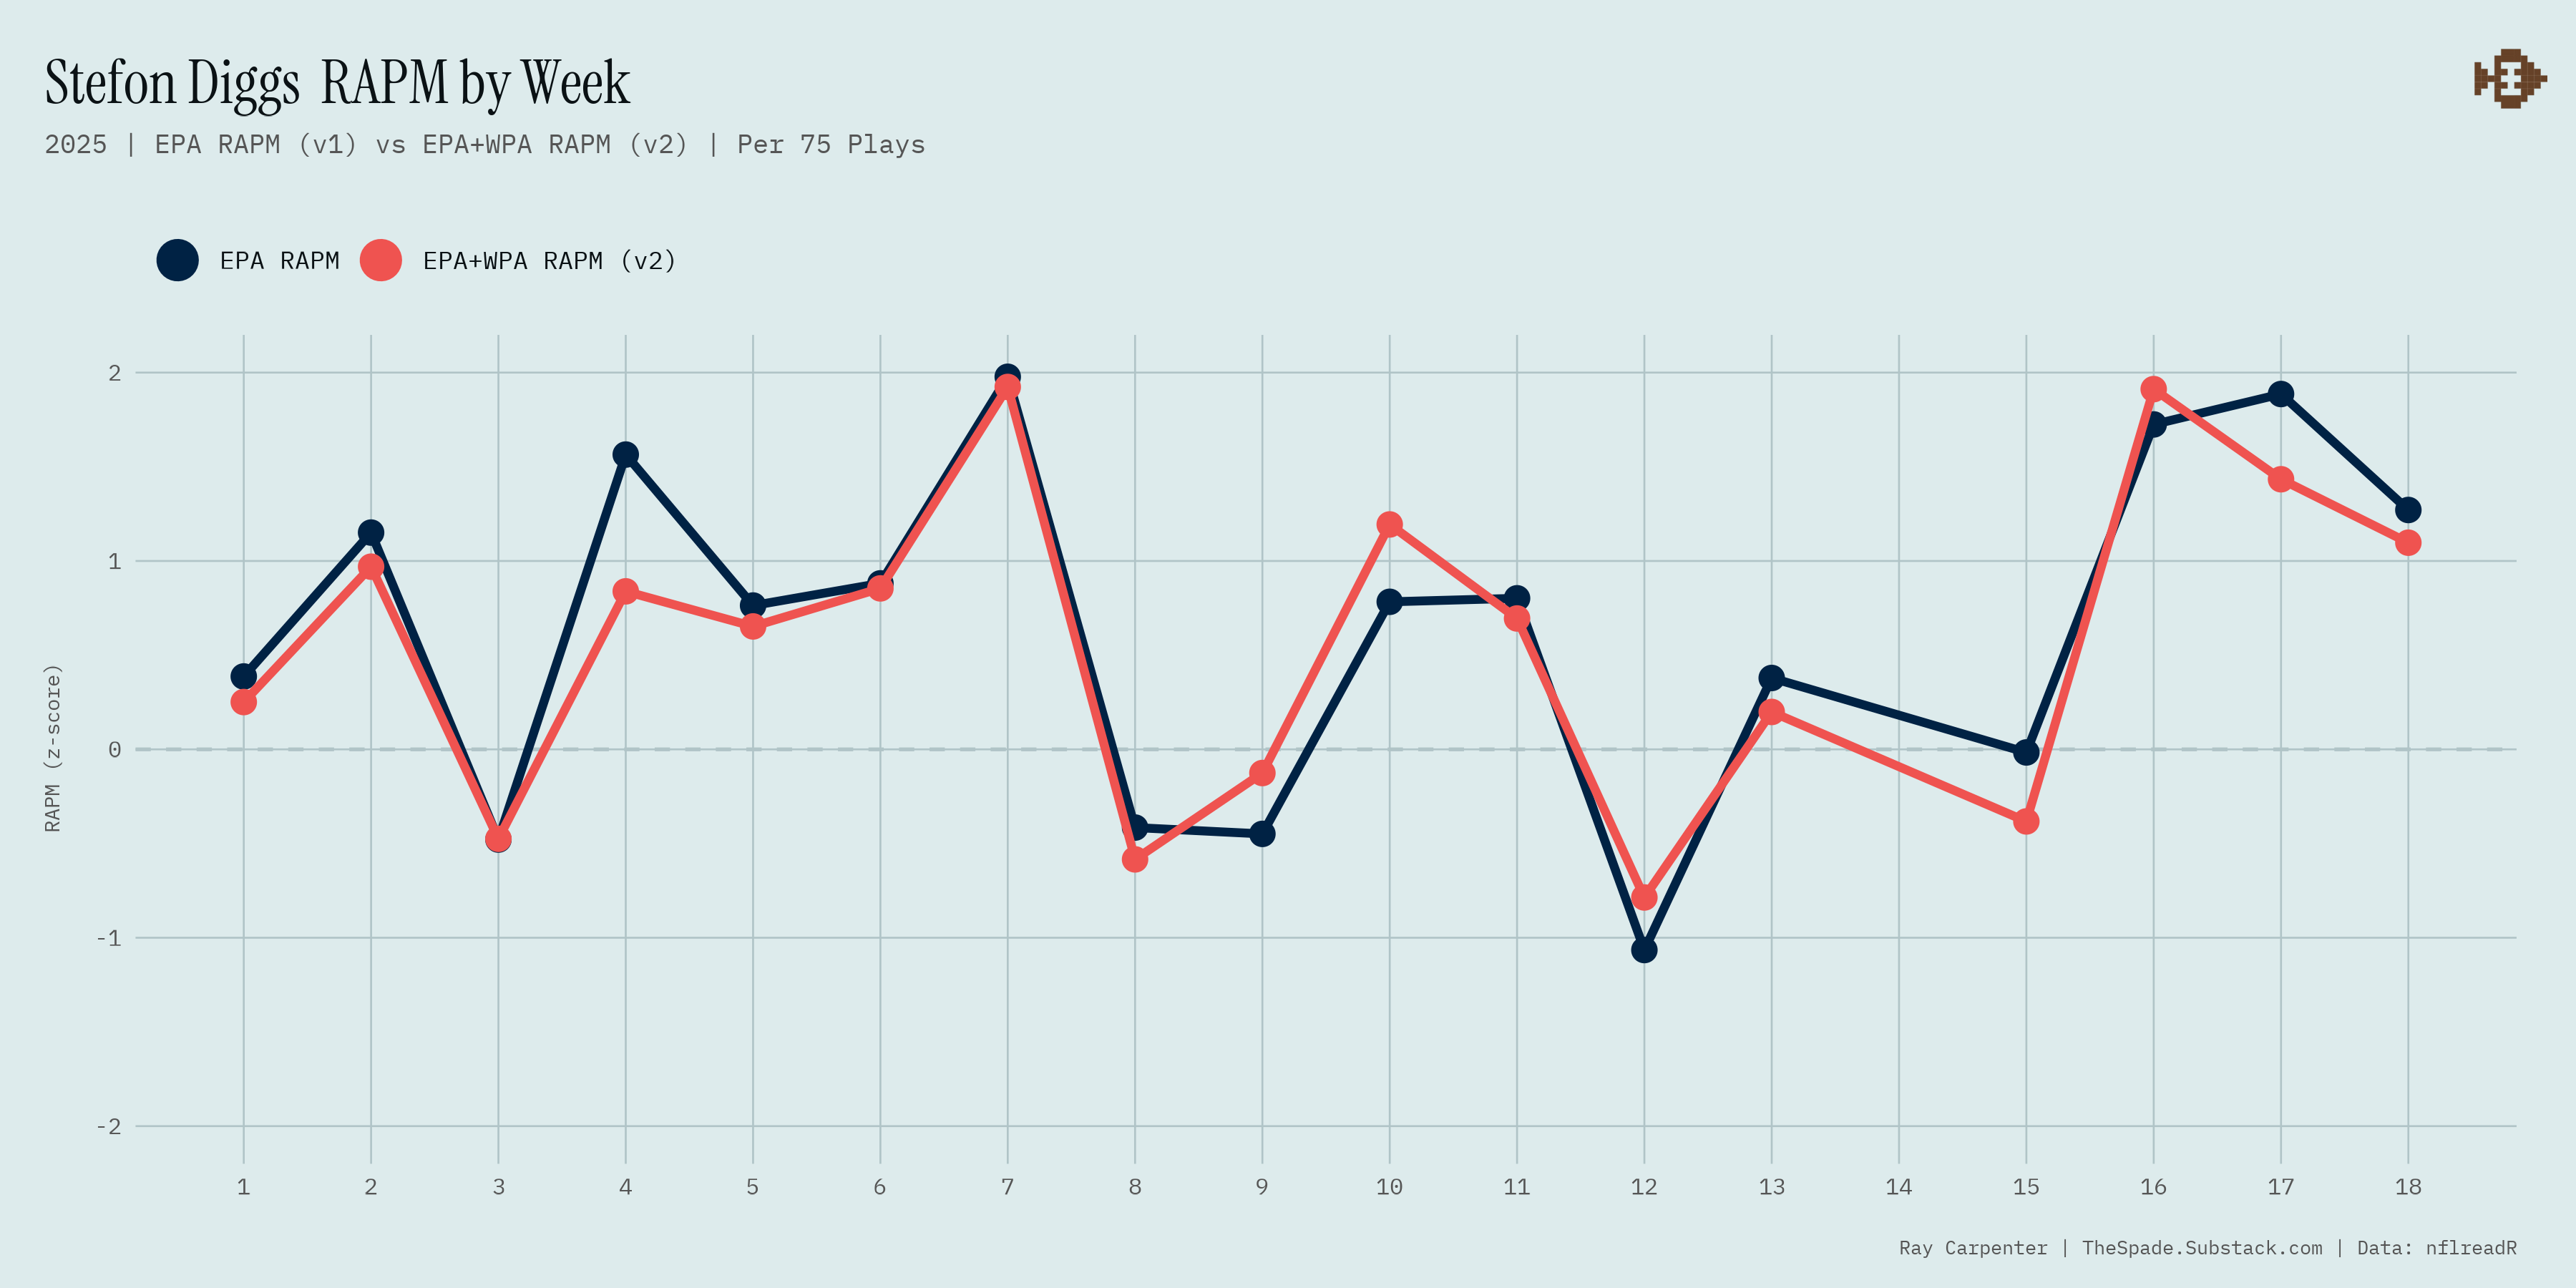
Here’s a simple line chart comparing the differences in the two versions:
And one for Derrick Henry too:
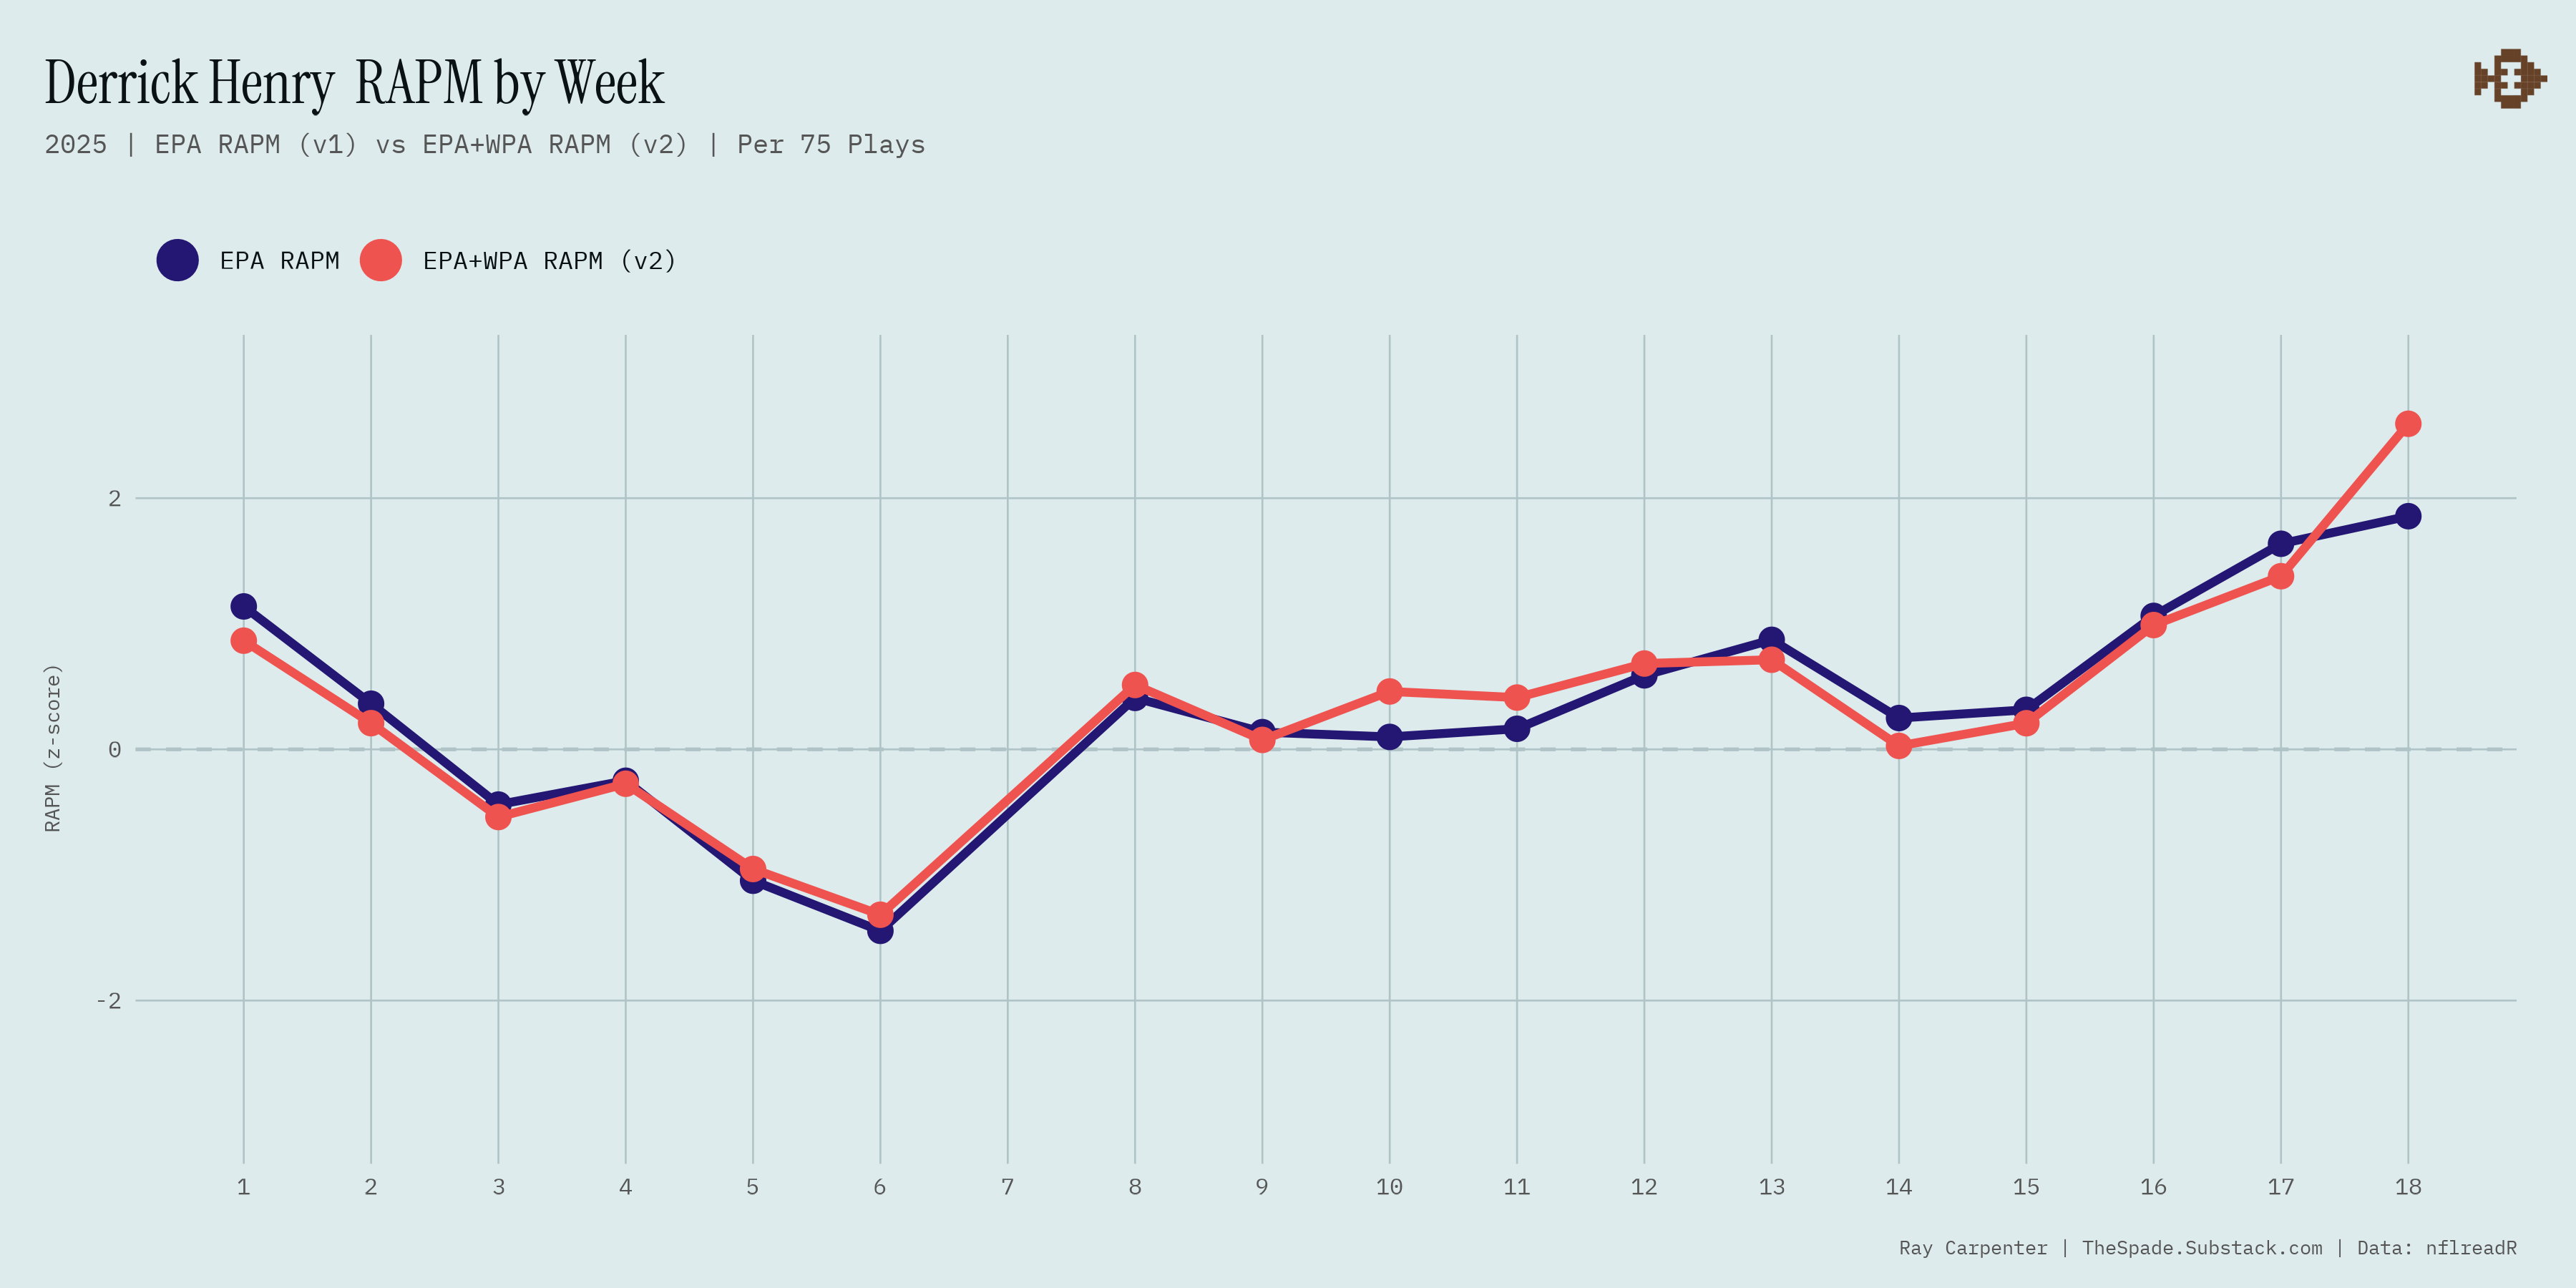
I think Henry’s graph shows where the two versions separate themselves from each other. If you remember, that week 18 game was the high-stakes one where the Steelers won the AFC North in that game against the Ravens 26-24. Derrick Henry had a big game in a game that mattered a lot, if that makes sense.
I like how it’s performing, but don’t like how highly ranked players who didn’t play much last season like TJ Bass and Samaje Perine are. Let’s add one final step to try and account for that.
NFL RAPM as it stands today
At the end of calculating this stat, I added some shrinkage to the model to directly penalize players who played less often in certain positions to account for the model favoring offensive linemen and the model favoring players who didn’t play much. I tried to quantify position group workloads so that an OL with 3,000 snaps isn’t treated the same as an RB who plays 3,000 snaps. Here are the results:
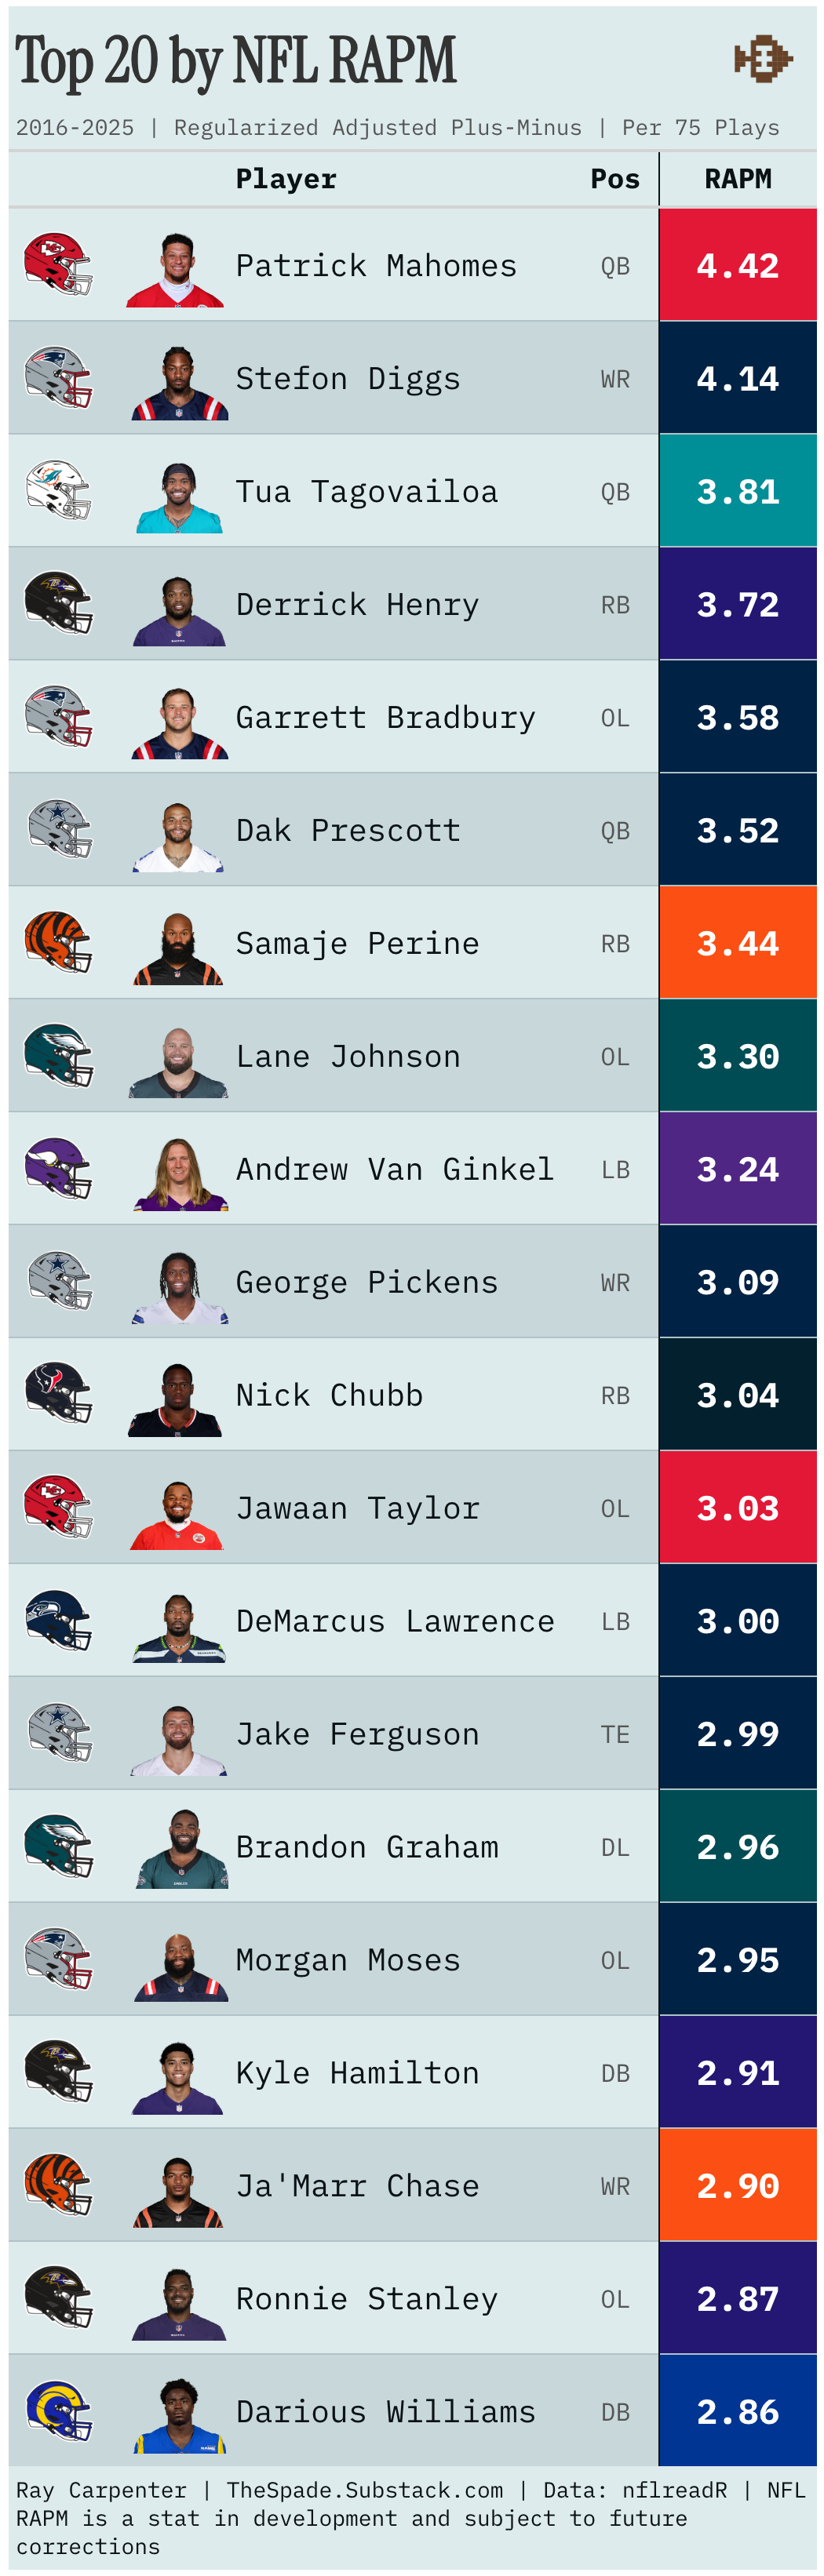
As you can see it shrunk everyone’s numbers, but it kicked out some low-snap and low-usage players from the top 10. Might’ve over-corrected it, but we can re-visit this soon. It’s also heavily favoring offensive linemen still who missed time. And it still loves Stefon Diggs and Samaje Perine. This could be indicative of these two players getting reps in more favorable game scripts. I also think there’s too heavy bias towards players who miss large chunks of time through injuries. But this top 20 has good players (or players who were good at some point from 2016 to now) on it.
I wanted to do one more peek under the hood before putting this to rest for the week. Do better teams have more players with higher RAPMs?
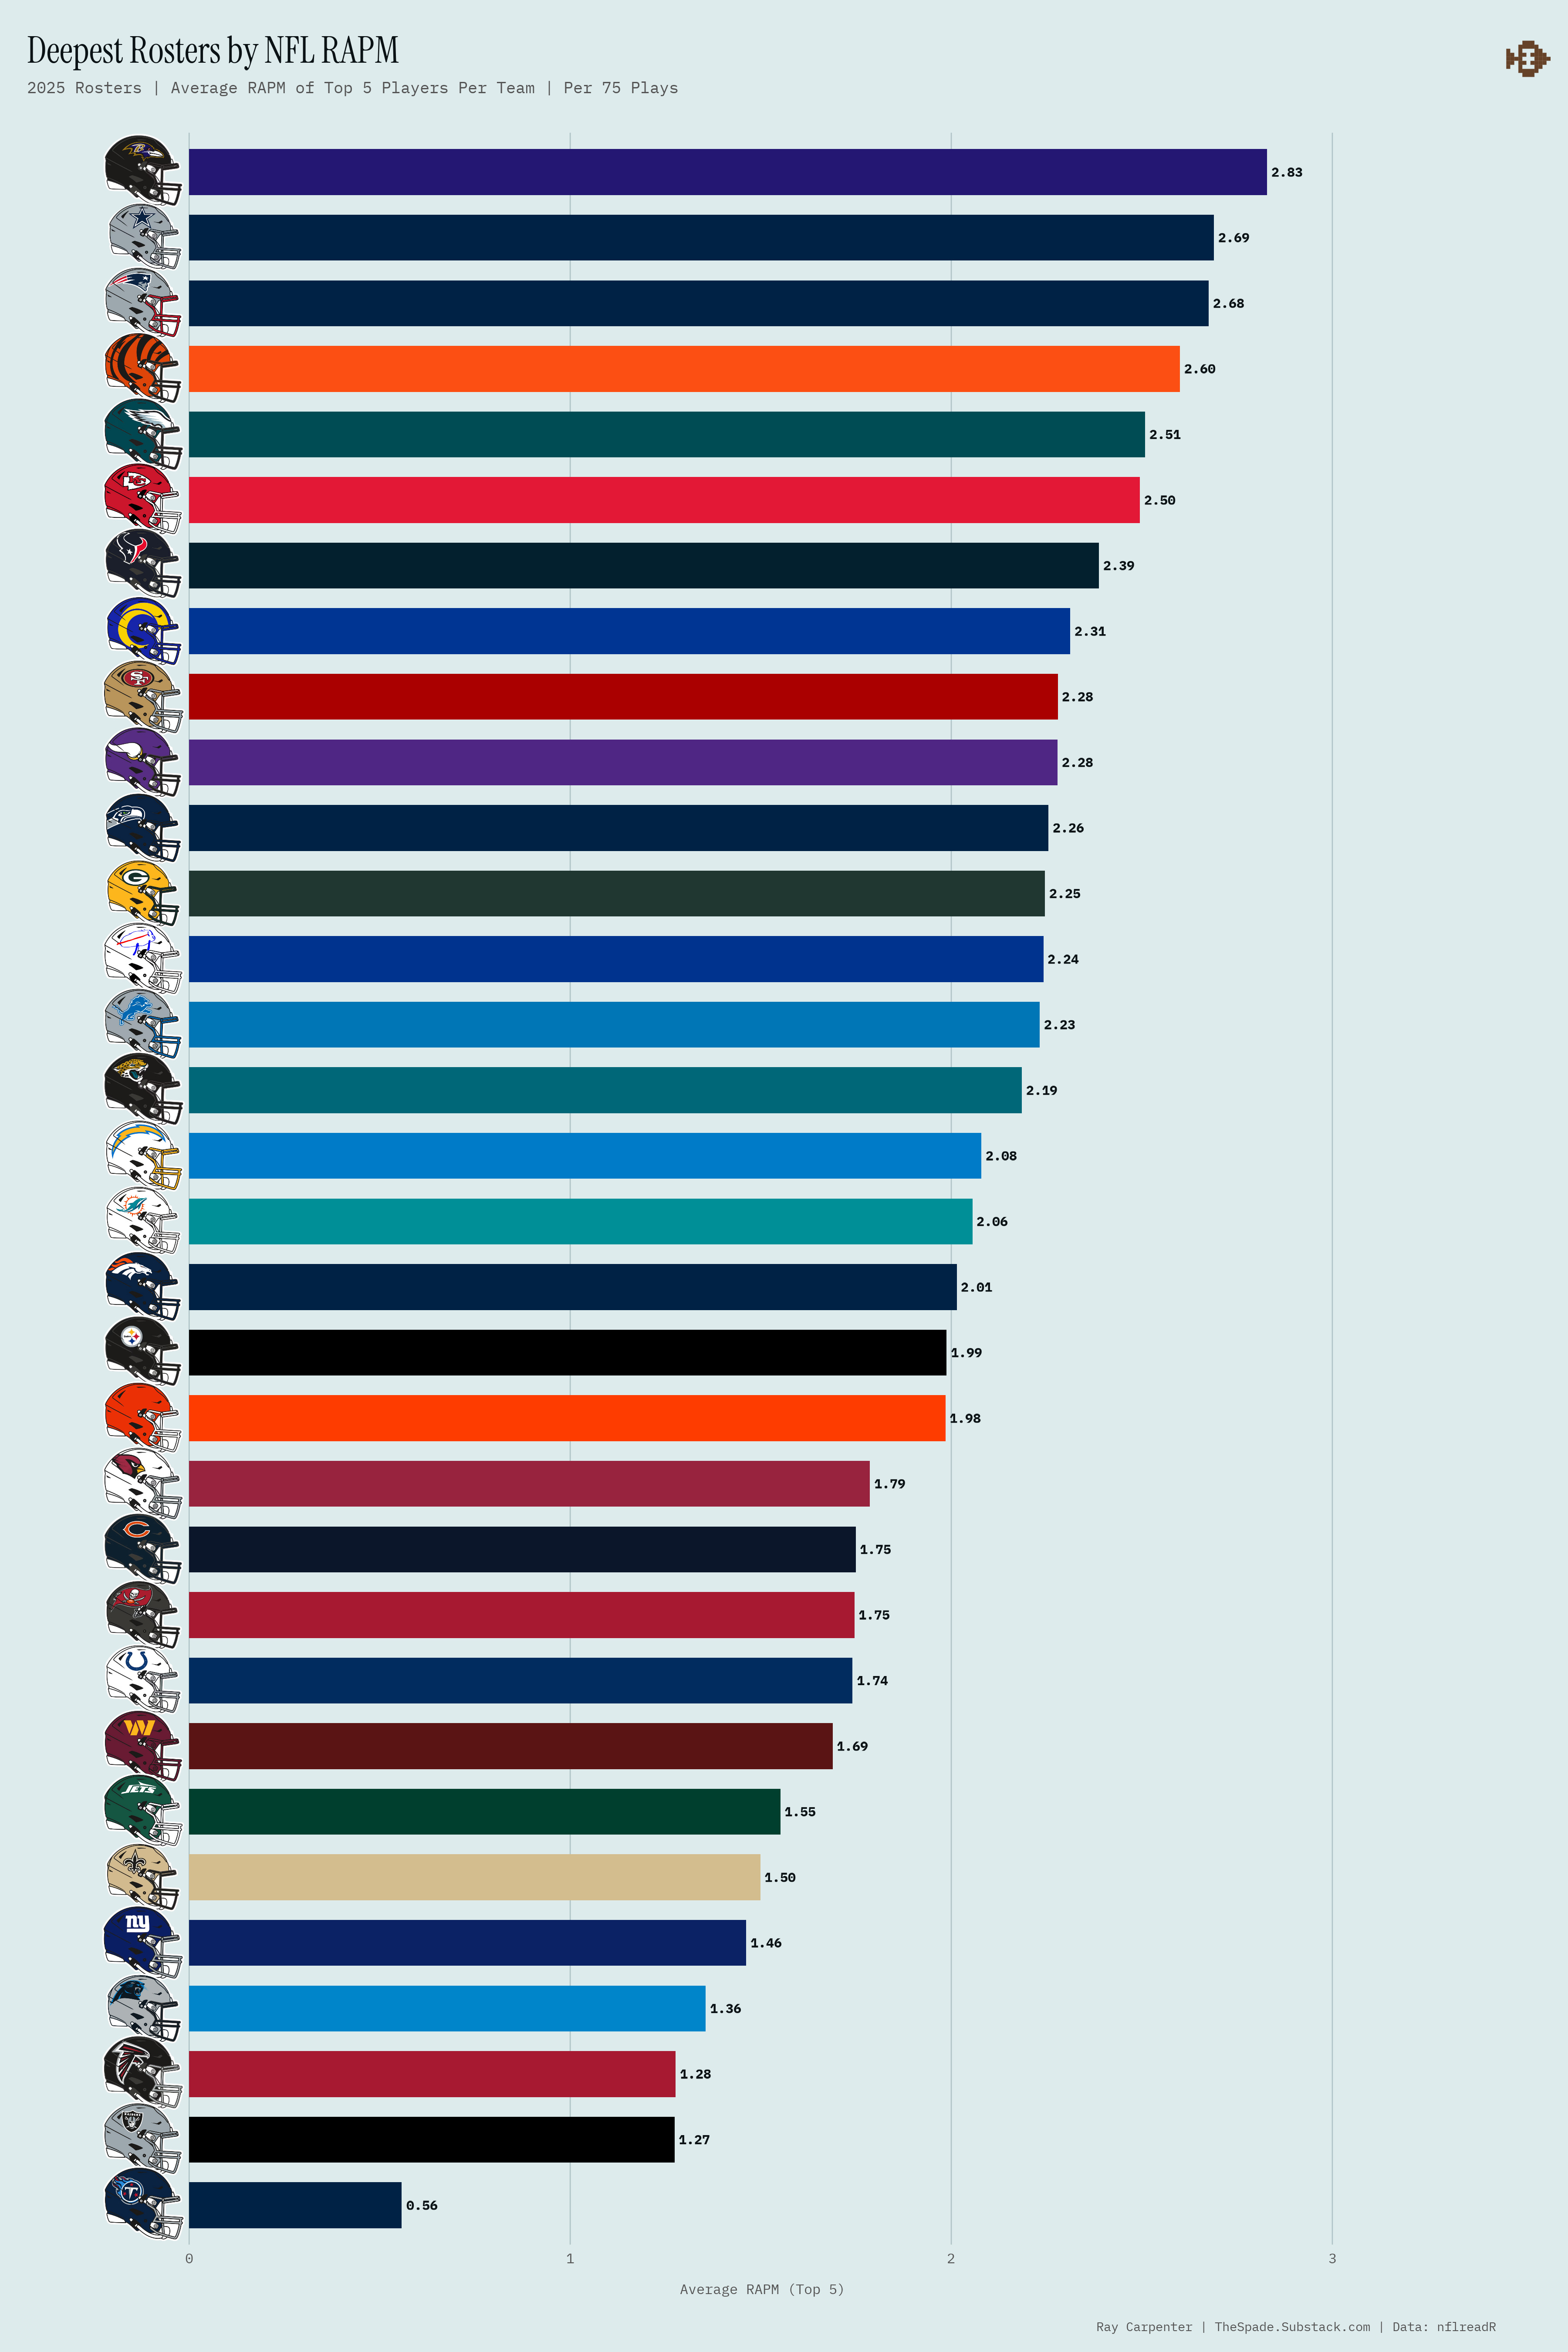
Still not getting much insight from these.
Limitations
I think these are obvious here. 82 is greater than 17. The NBA simply has a larger sample size than the NFL does, and the sport lends itself to a more democratic form of responsibility than football does. We’re using Expected Points Added here, and if a quarterback gets sacked on a pass play, that’s a play with negative EPA. Due to the data we have available to us, it doesn’t matter exactly where that defensive player attained his sack from. If he lined up off the left tackle, bull-rushed him, and sacked the QB, this current RAPM formula punishes every player equally for being on the field for that negative play. Including the wide receiver on the opposite side of the field. You should be saying to yourself, like I am, isn’t that unfair? You’d be correct. And we’re still only covering two sides of the ball, offense and defense. Apologies to special teams, and I’m bummed I couldn’t produce something that yielded effective results for them. That’s an extremely important facet of the game. Also, plus/minus is a concept that’s been around for a while in the NBA. There’s nothing quite like it (yet) for the NFL, so this was two steps within one study, or maybe even three. We had to create a plus/minus, then adjust it and regularize it. Working with NFL data is like trying to get blood from a turnip, especially from free sources. I think that’s why I enjoy it so much.
I’d love to explore this further with some different weights, but for the sake of weekly content, we’re going to have to punt that to another date. This is another existential constraint, how I dedicate one week to heavy data science NFL projects then keep it moving. I’d love to return to this one eventually though. I bit off more than I could chew in one calendar week with this one, but it’s all good. I’m getting exactly what I wanted out of these exercises: learning, great conversations, and exposure. But this was definitely a heat check for me. To think I could create an entire advanced metric in under a week was bold, and I had fun trying.
I hope that with these write-ups, my thought process and data exploration techniques are clear. Results definitely vary week over week with regards to how effective or applicable the things I write are. But I hope my methodology is easily followable. I usually dive into a topic first and iron out all the wrinkles later. I will definitely return to this one because there’s much more digging to be done and improvements to be made. Have a great day, everyone, and I will be back in your inboxes with a tutorial this Friday. - RC
Fascinating!
One thing that you talked about a little is the injury piece. In the NBA, even the best players will only average 30-35 minutes per game. That works out to ~60-70% of the possible minutes they could play.
Whereas in the NFL, your star offensive linemen are rarely missing snaps in a game. Without injuries, not missing an offensive snap all year is very doable.
That means that unlike in the NBA, injury is really the only way good linemen would leave the field. This seems to be why they benefit the most; assuming you're the only starting lineman that's hurt, you accrue all of the "difference" between yourself and the backup. The other 4 linemen don't get that benefit unless they get injured or substituted.
You mention a similar concept in the case of Tua, correctly pointing out that he gets a bump due to the horrific backups they had. That's kind of by design (if Tua is way better than a backup QB, he should have a high RAPM), but you just don't get to see that difference for any QB that started all 17 games.