
Tutorial: How to Make Transfer Portal Maps in R
Friday Morning Knowledge

Good morning everyone,
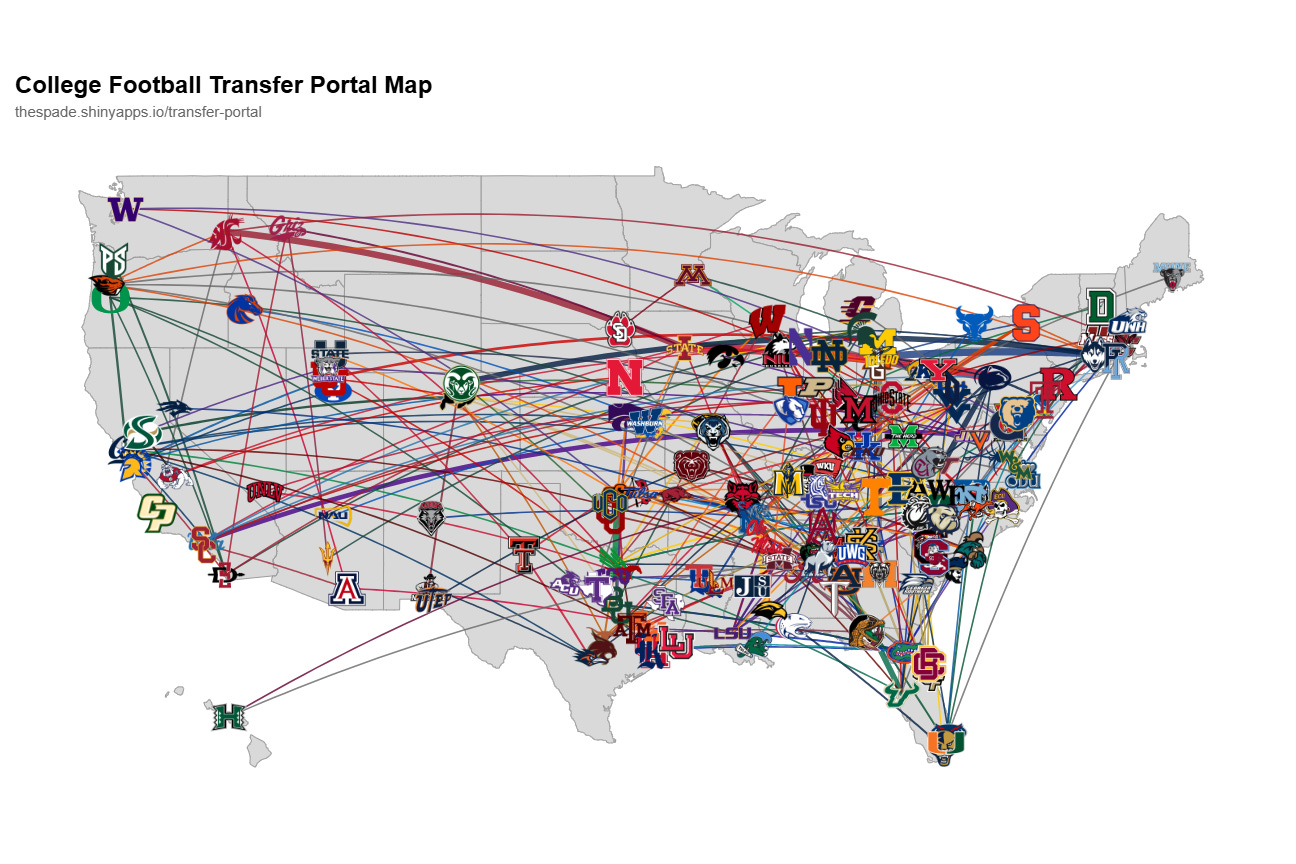
I had originally planned a tutorial on NFL RAPM, but I consider that stat still in progress as I’m not happy with the results it’s yielding yet. While I put that project on the shelf for a minute, I wanted to get another tutorial out there, for the transfer portal maps you’ll find on this Shiny App I built a few months ago. These maps served as the proof of concept for transferportl.com where I now keep track of college football transfer patterns and try to predict them too. For anyone reading, I’d love some feedback on the tutorials themselves. Let me know if the format is easy to follow, if the Substack bookmark is easy to navigate, if you’re finding these useful, etc. Better yet, send me some of your projects that I inspired you to build. I’d love to hear about them.
The Spade is an entirely reader-supported weekly football analytics newsletter covering topics like the NFL and college football. If that sounds interesting to you, I’d love to have the privilege of sending you weekly emails. Here’s how you get on the list for completely free:
Let’s dive into some transfer portal maps.
Step 1: Libraries
I want to take a minute to thank Substack for fixing their code blocks. You can choose your language now in a header box, and it’ll even auto detect.
library(cfbfastR) # college football data
library(dplyr) # data transformation
library(ggplot2) # plotting
library(ggimage) # for putting team logos on map
library(maps) # should be self explanatory
library(jsonlite)